AssetBook Graphs provides a powerful visual representation of historical and projected production, either at a well level or for a group of wells.
AssetBook Graphs analyzes wells in Western Canada and assigns either an exponential decline or a decline based on pool or zone averages. Well declines are amalgamated to provide you with corporate decline graphs. Land graphs provide a look at bonuses and lease expires in an area.
Key functionality found in the Graphs module includes:
- Full production history
- 6 years of forecasted production data
- Rate vs. Cumulative Production Graphs
- Ability to easily change scales, units, linear vs. logarithmic
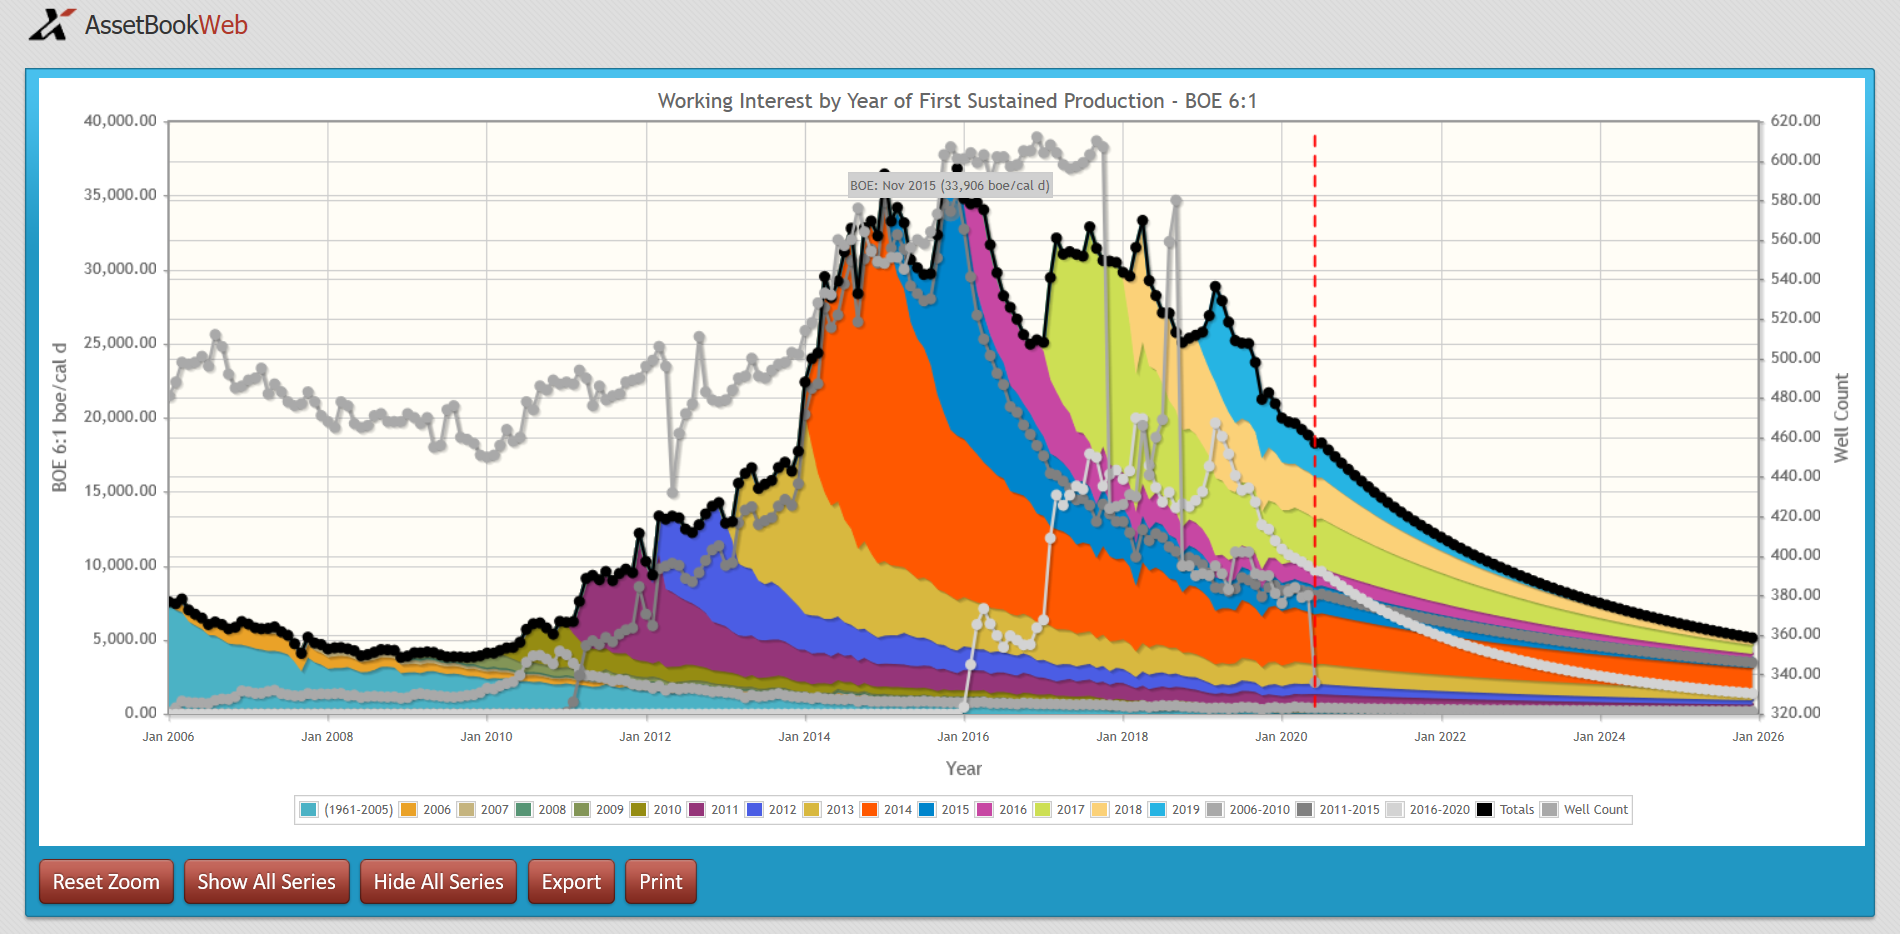
View Historical & Anticipated Production
Leverage the power of Graphs to obtain group production graphs for any list of wells from AssetBook. Evaluate wells in a particular area or a zone within an area and analyze a company’s core area.
With Graphs, you can obtain historical production on a gross or working interest basis, and filter down to a customized well list.
- View company production performance – Display a company’s portfolio of assets and see how that group of wells has performed over time.
- Produce production forecasts for any public or private company – Display amalgamated exponential well declines.
- Determine a company’s production vintage – Time sliced graph displaying each year of production. Easily visualize the age of a company’s assets.
- Compare potential acquisition candidates – Compare up to 15 companies based on total BOE/day, average well per year, and number of wells.
- Merge potential acquisition candidates – Combine up to 15 companies to determine whether a proposed merger would be accretive or dilutive based on reserves.
Deprecated: Function wp_make_content_images_responsive is deprecated since version 5.5.0! Use wp_filter_content_tags() instead. in /home/yourpreview-xi/htdocs/xi.yourpreview.net/wp-includes/functions.php on line 6170
Would you like to see AssetBook Graphs in action?
Demonstrations can be scheduled virtually, at your location, or at our downtown Calgary training facility.