Sed diam nonummy nibh euismod tincidunt
Ut laoreet dolore magna aliquam erat volutpat. Ut wisi enim ad minim veniam, quis nostrud exerci tation ullamcorper suscipit lobortis nisl ut aliquip ex ea commodo consequat. Duis autem vel eum iriure dolor in hendrerit in vulputate velit esse molestie consequat, vel illum dolore eu feugiat nulla facilisis at vero eros et accumsan et iusto odio dignissim qui blandit praesent luptatum zzril delenit augue duis dolore te feugait nulla facilisi.
For years, XI Technologies has been dedicated to sharing knowledge we’ve obtained via our data and research in weekly posts we call XI’s Word to the Wise. As we conclude this year, we reflect on the most impactful articles that resonated with you and your peers, offering a trove of knowledge and analysis.
#1. M&A Snapshot – Crescent Point Energy Corp Asset Purchase
In a landscape shaped by geopolitical shifts and economic unpredictability, mergers and acquisitions (M&A) emerged as crucial strategic maneuvers. Against this backdrop, Crescent Point Energy Corp made a substantial move with the announcement of their $375 million acquisition of Kaybob Duvernay assets from Paramount Resources Corp. Our rigorous examination, facilitated by our advanced AssetSuite software, provided stakeholders with unparalleled insights into this transformative deal. XI’s reports, downloadable below, allowed for a deeper understanding of both companies, enabling a nuanced comparison critical for strategic evaluation.
Navigating through this deal required a multifaceted approach. Paramount’s recent Life Cycle Analysis (LCA) report, available for download, illuminated key trends, indicating a 5% production increase over three years. However, the report highlighted a substantial 54% inactive well rate compared to Crescent Point’s mere 5%, hinting at Crescent Point’s potential to strategically absorb these inactive wells. Furthermore, the LCA Report identified potential acquisition targets such as Spartan Delta, PetroChina, Ridgeback Resources, and HITIC Energy, highlighting low marginal well rates, low inactive well rates, and distant corporate crossover dates.
Download the Company Book for Crescent Point and Paramount, allowing you to navigate the core complexities of Paramount’s Duvernay assets, which constitute the heart of this transformative transaction.
#2. Blueberry River First Nations Area Overview
In June 2021, the BC Supreme Court delivered a landmark judgment in favor of the Blueberry River First Nations, affirming the violation of Treaty 8 rights due to years of industrial development in the upper Peace River region of northeastern BC. Fast forward to January of the following year, and a historic agreement was reached between the BC government and the Blueberry River First Nation. This agreement holds significance for the entire northeastern BC region, where various First Nations are Treaty 8 signatories. Covering approximately 38,000 square kilometers, the Blueberry River’s traditional territory is central to the implications of this accord. The deal marked a pivotal moment in addressing the historical impacts of industrial development on Indigenous rights in the area.
Exploring the top-producing companies within the Blueberry River claim area, as documented by XI’s AssetBook, Ovintiv, Tourmaline, ARC Resources, Canadian Natural Resources, and Petronas Energy emerged as major players, contributing 96% of the total production. The focus shifted towards environmental stewardship and remediation as a $200 million restoration fund accompanied the new agreement. With an emphasis on cleaning up liabilities, the region, hosting around 3,800 inactive licenses, carried an associated liability cost estimated at approximately $350 million, as indicated by XI’s 2022 Cost Model.
This remains one of our most-read articles well into 2023, and we continue to get requests for the downloadable report of all companies with a working interest in the area. Now you can also download our ARO Manager Project Overview Report.
#3. What Do Tax Pools Have To Do with M&A?
As the energy sector emerged from the pandemic-induced downturn, oil prices staged a robust rebound, prompting companies to cautiously revive shelved capital programs. Yet, a new challenge arose amid this resurgence: the intricacies of managing taxes. In Canada, businesses, especially in the energy industry, can leverage tax deductions and credits generated from capital spending on tangible and intangible assets. Tangible assets, such as equipment, can be deducted over time, subject to specific capital cost allowances. Unused balances offer the flexibility of deductions in subsequent years. In this climate, where strategic decisions can significantly impact a company’s financial health, understanding the nuances of tax pools becomes crucial.
In November, XI Technologies presented a comprehensive whitepaper, “The Tax Man Cometh – How Strategic Acquisitions Can Help Your Issue,” delving into tangible strategies and real-world examples that shed light on the timely consideration of tax pools in the context of mergers and acquisitions. It quickly rose to third place in our most-read articles of the year.
#4. Tourmaline Oil Acquires Bonavista Energy
Tourmaline Oil Corp’s notable $1.45 billion acquisition of Bonavista Energy Corporation intrigued industry observers. Leveraging our AssetBook, we dissected key players and regional dynamics. Our suite of tools, including the AssetBook ARO Manager, facilitated a comprehensive assessment of Asset Retirement Obligations, crucial for strategic planning. TAQA North Ltd. emerged as the dominant force, contributing approximately 38,000 boe/d of the 326,000 boe/d produced in the area. With 245 producers, the top 10 players hold a significant 63% share of production, underscoring the strategic importance of this predominantly gas-producing region, with over 80% of production sourced from gas.
For those keen on delving deeper into the dynamics of this acquisition, our downloadable information on the companies in this area provides invaluable insights. Additionally, as Bonavista boasts a substantial 71% working interest average, our AssetBook ARO Manager tool can be pivotal in assessing their actual Asset Retirement Obligation.
#5. Peyto Exploration & Development Corp. Acquires Repsol Canada Energy Partnership
In a burst of late summer M&A activity, Peyto Exploration and Development Corp (“Peyto”) revealed a significant move on September 6, 2023, with the announcement of its agreement to acquire Repsol Canada Energy Partnership (“Repsol”) for a sum of US $468 million. XI Technologies conducted a comprehensive assessment of the transaction, scrutinizing each company’s asset profile and the combined entity to extract valuable insights.
The A&D Workflow case study based on Repsol Assets is available for download.
We extend our gratitude to all our readers and subscribers who engaged with our content throughout this year. Join us in 2024 as we continue to provide in-depth insights through XI’s “Word to the Wise.”
For a deeper exploration of how our software can elevate your analysis of companies, packages, drilling data, or regions throughout Western Canada, visit our website or connect with us. Expect a year ahead filled with richer discoveries and deeper insights from XI Technologies!
Each week, XI Technologies scans its unique combination of enhanced industry data to provide trends and insights that have value for professionals doing business in the WCSB. If you’d like to receive our weekly Word to the Wise in your inbox, subscribe here.
Last week we discussed how Directive 88 may be affecting Junior and Micro companies (please find article here). In keeping with the trend of Major and Intermediate deals is the Crescent Point Energy Corporation’s (Crescent Point) purchase of Hammerhead Energy Inc. (Hammerhead). XI’s role is in providing data and software tools that help evaluate and scope for deals long in advance. Today, our M&A snapshot after-the-fact provides insights for your own evaluations that can be done without a data room and/or for finding “one-off deals.”
When assessing this transaction through different lenses using AssetSuite software tools, we see each company’s asset profile, plus the combined entity and gain valuable insight into the transaction beyond announced high-level acquisition highlights.
Deal Metrics
Crescent Point contributes 72% of the production to the combined entity. The companies are relatively similar in terms of operatorship (licensee on file) in that both have a high percentage operatorship, with Crescent Point at 96% and Hammerhead at 99%.
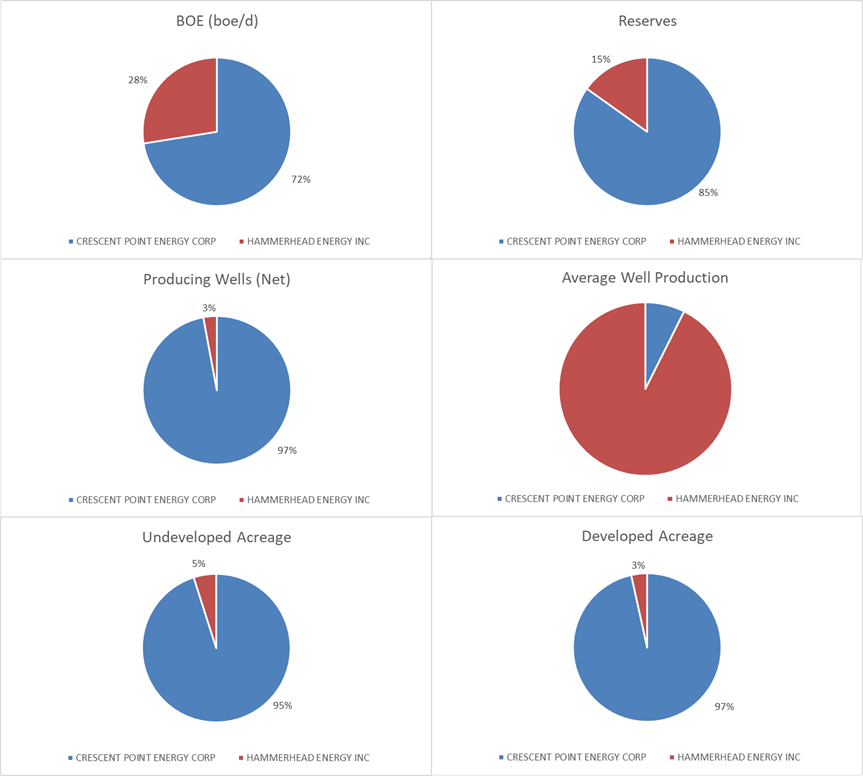
Figure 1 – Working Interest values for Crescent Point (blue) and Hammerhead (red). Source: AssetBook.
While the absolute numbers tell one story, accretion and dilution metrics tell us more. Looking at the AssetSuite summary, we can calculate some accretion and dilution metrics for this transaction relative to the increase in production.
Per Figure 2 below, this deal is largely accretive. Crescent Point’s production base grew by 38%, operatorship by 1% and working interest by 2%. There is a decrease in the BOE RLI which is to be expected and fits in Crescent Point’s balanced portfolio. These assets are meant to augment their high rate of return but shorter cycle assets in the Montney and Duverney play opposed to their long cycle Saskatchewan assets which will balance out these shorter life assets.
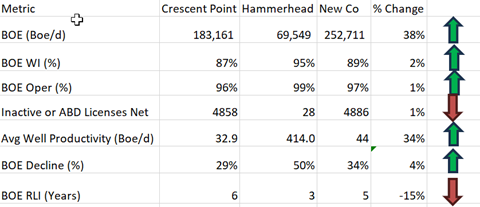
Figure 2: Deal Metrics.
Above numbers are based on three-month average to August production with raw gas numbers at a 6:1 gas to oil conversion. We recognize that Crescent Point’s Kaybob Duverney and Montney plays are likely in the oil phase of development at a different ratio. Source: AssetBook and ARO Manager.
As we can see, the contribution of inactive licenses did have a net negative effect, but very minimal given how accretive these assets are to Crescent Point’s portfolio.
Crescent Point is very spread out over the Western Canadian Sedimentary Basin however, this acquisition augments their recent strategy of moving into the Kaybob Duverney and Montney liquid rich assets that have a very high and quick rate of return. Crescent Point is primarily an oil company and while the AssetBook shows their production as 42% oil based on raw production from the well head, it is again important to note that their Montney assets are in the oil phase of development and therefore this ratio should skew closer to over 50% based on true boe production.
CORE AREA
Crescent Point mentions this transaction expands their core operations into their Montney play.
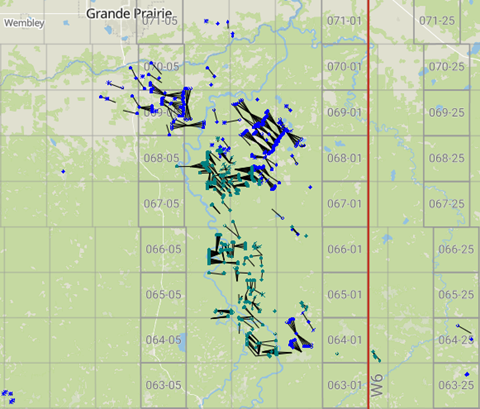
Figure 3 – Map of Crescent Point (Blue) and Hammerhead (Green) Core Area. Source: AssetBook.
This deal is primarily concentrated in the prolific fields of Elmworth and Karr (as defined by the AER). With the AssetBook we can create an area around these assets to see all other players that may be affected by this deal.
ARC Resources Ltd. (Arc) is the largest player in this area with approximately 108,969 boe/d of production. This area makes up 19% of Arc’s production. Notably, this area makes up 63% of Paramount Resouces Ltd.’s (Paramount) production falling in the top 10 producers of this area with approximately 91,161 boe/d.
There are 31 companies with ten or more boe/day in this area. Download more information on a full list of companies in this area here.
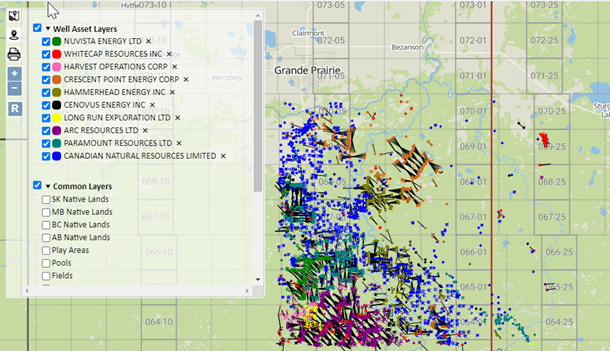
Figure 4 – Top 10 companies in Core Area. Source: AssetBook.
Liability Overview
As the AER is still looking at directive 11 for LCA liability costs and it is important to see the liability cost of the transaction we have used XI’s LLR module to evaluate this. Using an LLR analysis, this deal is slightly accretive to Crescent Point’s LLR ratio increasing it by 2.9. According to AssetBook’s LLR/LCA Module (which only accounts for licensed assets), Crescent Point will absorb $33,708,016 in deemed liabilities, all from Alberta. It’s worth noting that we are not privy to private Site-Specific Liability Assessments, and the deal does involve a number of large-scale facilities, including large scale gathering systems. The majority of the infrastructure is tied in to third party processing plants.
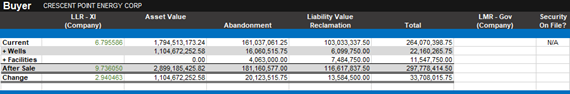
Figure 5 – LLR for Crescent Point, pre- and post-transaction. Source: AssetBook LLR Module.
This figure is slightly higher than XI’s ARO Module working interest calculations which indicates Crescent Point will absorb $33,124,899 in liabilities. As indicated by the very low number of inactive or abandoned liabilities, on a high-level glance, these are very clean assets.
Are there any Emissions Impacts?
While not always discussed as strategic rationale or mentioned in press releases, the emissions impact on the post-transaction entity can have notable implications, particularly form a carbon tax or credit perspective. This deal in particular has minimal overall impact on post-transaction Crescent Point but will bump up their XI-calculated 12-month trailing Scope 1 (fuel, flare, vent) GHG intensity 0.014 to 0.015. The majority of the GHG emissions comes from five Hammerhead facilities that produce ~20k tonnes CO2e or higher. These facilities, as well as a few others, may have TIER-related carbon tax implications.
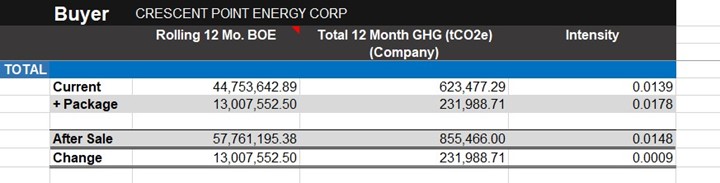
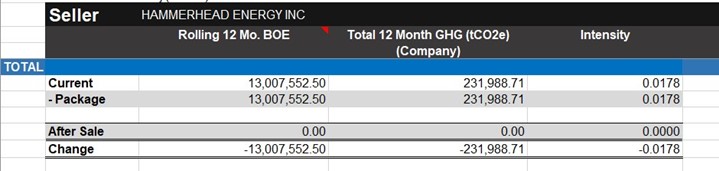
Figure 6 – Post Transaction Emissions Intensity (Scope 1: Fuel, Flare, Vent; TTM)
While analyzing deals after they are announced is interesting, tools that provide the leg up for looking at your own deals or finding deals proactively to create better value provide a significant advantage. For more results on this acquisition, or to learn more about how XI’s AssetSuite software can analyze potential mergers, acquisitions, and opportunities, including examining potential liabilities and emissions, click here
AssetSuite’s ARO Manager is the only standardized tool for estimating and monitoring asset retirement obligations in Western Canada’s oil and gas sector. To learn how ARO Manager can help with your planning and reporting of liability management, join us for our virtual information session.
Webinar: ARO Manager for Financial Tracking & Reporting.
When: Tuesday, December 5, 2023 @ 9:30am MT
Register here, or visit XI’s website and contact XI for a demo.
Each week, XI Technologies scans its unique combination of enhanced industry data to provide trends and insights that have value for professionals doing business in the WCSB. If you’d like to receive our weekly Word to the Wise in your inbox, subscribe here.
The merger and acquisition space in oil and gas has become heated again with multiple deals announced every month. During this exciting time, finding deals that are not is critical to being competitive. That’s where XI comes in. Our role in providing data and software tools that help evaluate deals long in advance. Today, our M&A snapshot after-the-fact provides insights for your own evaluations that can be done without a data room and/or for finding “one-off deals.”
Let’s look at one of the more recent transactions announced on October 31, 2023: Pine Cliff Energy Ltd. (Pine Cliff) purchased the outstanding common shares of privately held junior, Certus Oil and Gas Inc. (Certus).
When assessing this transaction through different lenses using AssetSuite software tools, we are able to see each company’s asset profile, plus the combined entity, to gain valuable insight into the transaction beyond announced high-level acquisition highlights.
Pine Cliff contributes 79% of the production to the combined entity. The companies are relatively similar in terms of operatorship (licensee on file) in that both have a high percentage operatorship, with Pine Cliff at 89% and Certus at 92%. Both companies also have a number of partners, with Pine Cliff having approximately 66% working interest of their BOE’s and Certus at 63%.
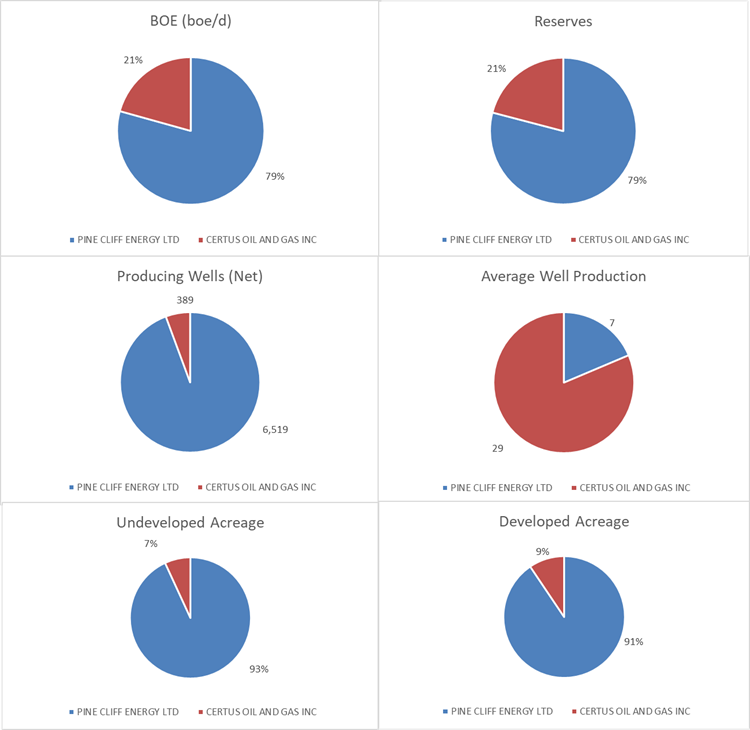
Figure 1 – Working Interest values for Pine Cliff (blue) and Certus (red). Source: AssetBook.
While the absolute numbers tell one story, accretion and dilution metrics tell us more. Looking at the AssetSuite summary, we can calculate some accretion and dilution metrics for this transaction relative to the increase in production.
Per Figure 2 below, this deal is largely accretive. Pine Cliff’s production base grew by 26%, operatorship by 1% with only BOE working interest decreasing by 1%.
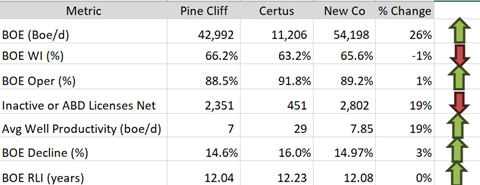
Figure 2: Deal Metrics. Above numbers are based on three-month average to August production with raw gas numbers at a 6:1 gas to oil conversion. Source: AssetBook and ARO Manager.
As we can see, the contribution of inactive licenses did have a net negative effect but by a minimal amount compared to the increase in boe/day and average well productivity.
CORE AREA
Pine Cliff mentions this transaction expands their core operations into the Caroline area of Western-Central Alberta.
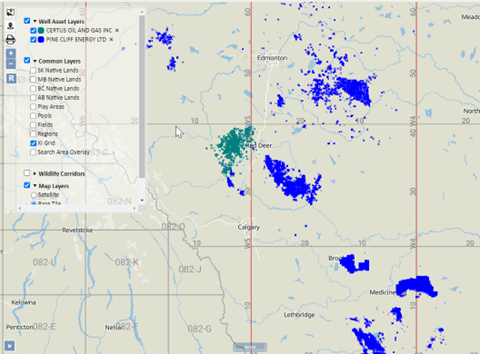
Figure 3 – Map of Pine Cliff and Certus Assets. Source: AssetBook.
Pine Cliff is very spread out over the Western Canadian Sedimentary Basin so this acquisition is an expansion into a new area instead of a consolidation of Core, as evidenced from the map above. Pine Cliff is primarily a gas company with just under 97% of their production from gas. Pre-deal, the bulk of their production came from the government-defined fields of Twining and Viking Kinsella. Post-deal, these are still core to Pine Cliff, but the production does move over more fields:.
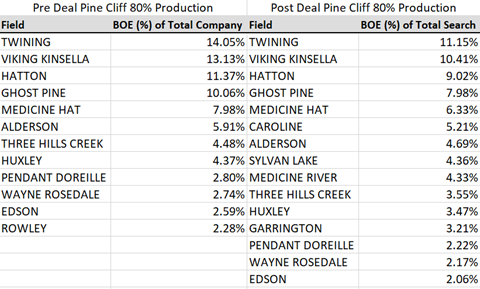
Figure 4 – Pine Cliff production by field before and after deal. Source: AssetBook.
With the AssetBook we can create an area around the Certus assets to see all other players that may be affected by this deal. Whitecap Resources Inc. (Whitecap) is the largest player in this area with approximately 35,000 boe/d of production. This area makes up 15% of Whitecap’s production. Notably, this area makes up 85% of Vesta Energy Ltd’s (Vesta) production falling in the top 10 producers of this area with approximately 13,000 boe/d. There are 92 companies with ten or more boe/day in this area.
Download more information on these 92 companies in this area here.
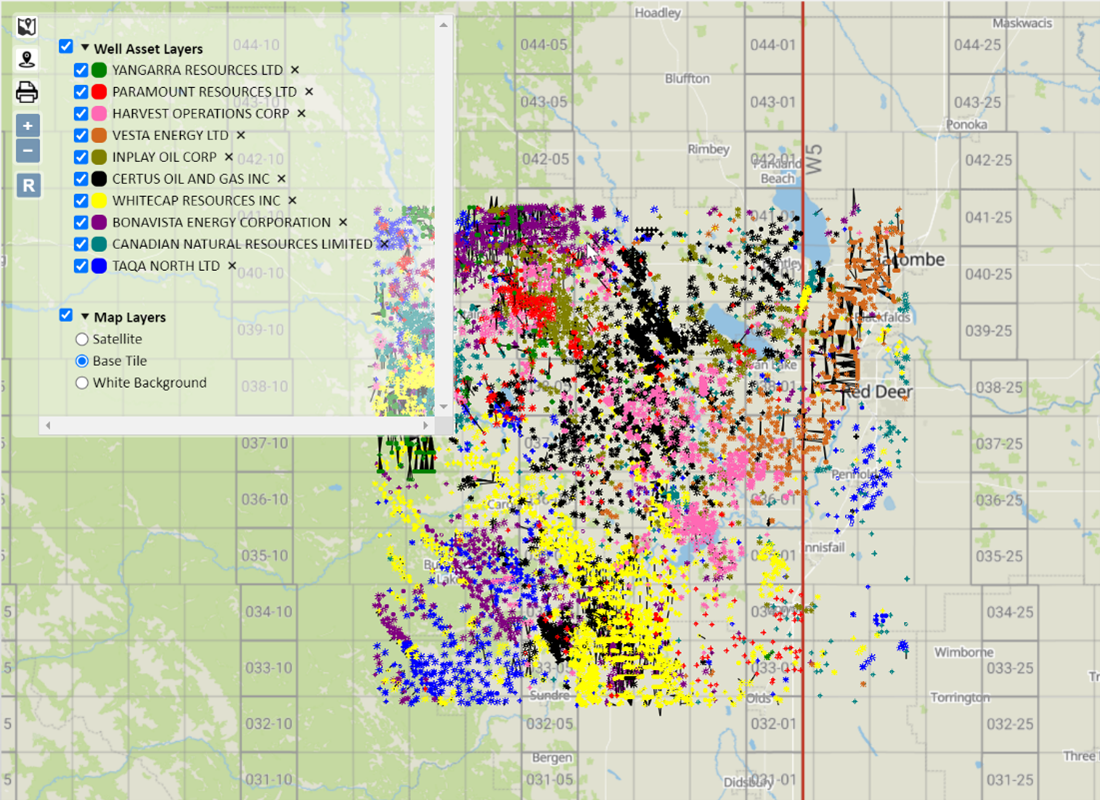
Figure 5 – Top 10 companies in Core Area. Source: AssetBook.
Liability Overview
Using an LLR analysis, this deal is slightly accretive to Pine Cliff’s LLR ratio. According to AssetBook’s LLR Module (which only accounts for licensed assets), Pine Cliff will absorb $131,868,545 in deemed liabilities, all from Alberta.
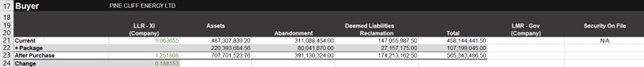
Figure 6 – LLR for Pine Cliff, pre- and post-transaction. Source: AssetBook LLR Module.
While analyzing deals after they are announced is interesting, tools that provide the leg up for looking at your own deals or finding deals proactively to create better value provide a significant advantage. For more results on this acquisition, or to learn more about how XI’s AssetSuite software can analyze potential mergers, acquisitions, and opportunities, including examining potential liabilities and emissions, click here.
Discover how XI’s AssetSuite and ARO Manager can help with the planning and reporting of liability management: contact XI for a demo.
Recently, XI Technologies attended the 2023 CALEP Conference in Kelowna, BC. The Canadian Association of Land and Energy Professionals did a fabulous job of balancing education and networking with a packed “work hard, play hard” schedule.
A team from XI Technologies has attended almost every CAPL/CALEP Conference since 2001 and it has evolved to the needs of the CALEP members just as our industry has evolved over the same time period. With a changing industry and the role of landmen adapting to become more involved in A&D, regulatory requirements, and business development, we now see many landmen interested in performing liability evaluations and assessing LLR/LCA implications as a regular part of their job. In many companies, the landman gets involved in high-level economics and business decisions before passing on to the technical team. As data and software experts, we too have grown from being strictly a scoping tool to fulfilling many different workflows in support of a wide variety of functions within the industry, from land and business development to financial, C-suite, geo-technical, and beyond.
With that in mind, there was a deep realization for all of us during the late afternoon on the second day of the conference that XI’s important data, newly adapted software applications, and our expertise itself, fit in nicely with several of the presentations and info sessions throughout the program. With AssetSuite front and centre, providing supportive information and insight into all that was explained, we couldn’t help but celebrate our 23 years of synergy. CALEP and XI… we’ve come a long way!
Each talk and panel discussion was engaging and informative. But with this synergy in mind, here are the ones we’d like to highlight:
- Bankers Panel –This was a robust discussion among those currently dealing with financial transactions in the energy industry. All the panelists happened to be clients of XI and we enjoyed hearing their perspectives. We found it interesting how much of the M&A activity happening today incorporates ARO and LLR/LMR considerations, a huge growth area for AssetSuite’s expansion as well. Jason Brooks from Invico had a fair amount to say on liabilities. His colleague, Bruce Cameron, reinforced with us afterwards, the importance of AssetBook and ARO Manager in his workflow. Other panelists included Arun Chandrasekaran from National Bank, and Jeff Lawson (formerly from Peters & Co.), now at Cenovus. We appreciated the valuable insight from this financially savvy group!

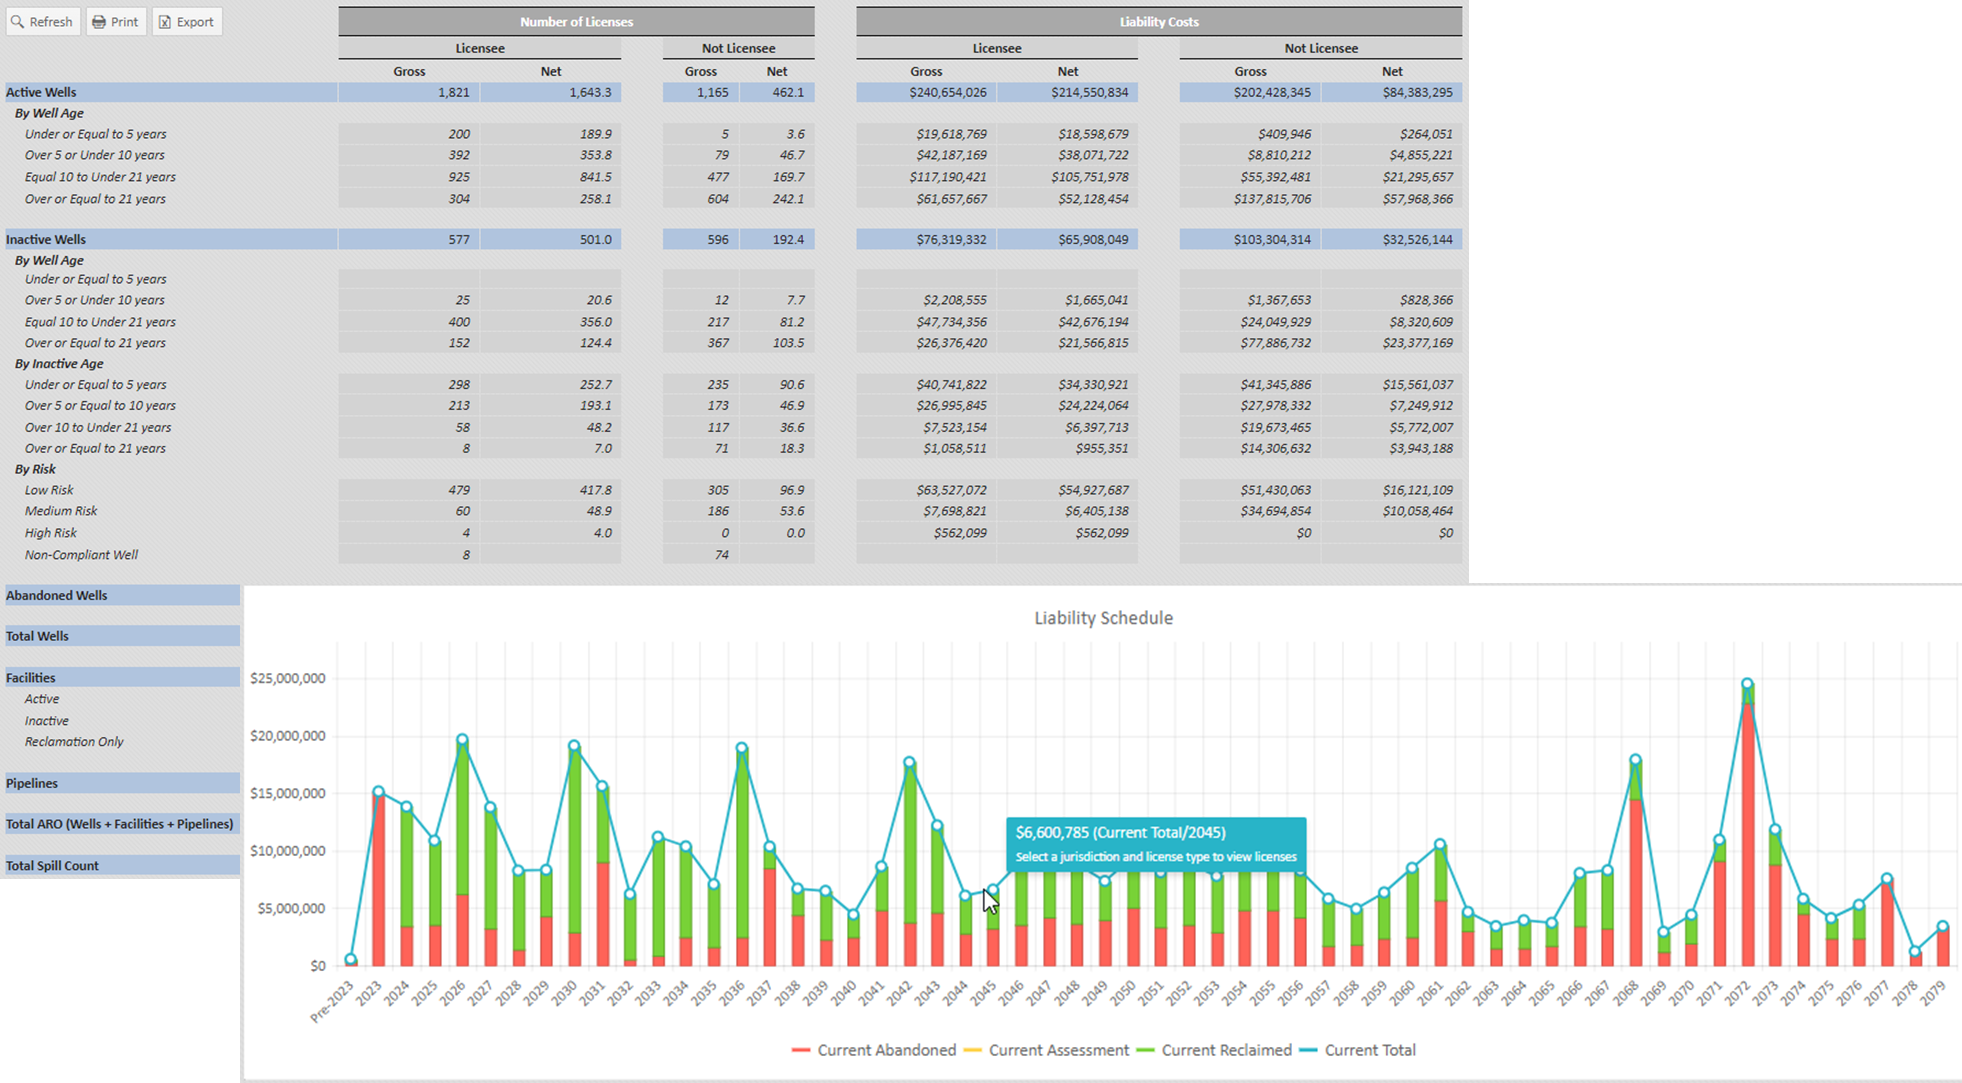
Figure 1: Liability costs for any company or area, broken down by age and risk class and a Liability Schedule with costs broken down by abandonment and reclamation date. - Building Meaningful Relationships Between Industry and Indigenous Peoples – Stephen Buffalo of Indian Resource Council and Judy Desjarlais of Blueberry First Nations. This timely and important discussion reminded us how working together can benefit both the industry at large and the First Nations communities. Partnerships need to be based on trust and collaboration. In our opinion, these relationships can be built and strengthened much more effectively when both parties have understanding, which comes with access to accurate information. XI’s AssetBook now has all First Nations boundaries available as search criteria and as map layers. We’ve been working with many Nations to help calculate assets and liabilities. There is something special about starting from a place of common understanding by honouring land information through real and reliable data.
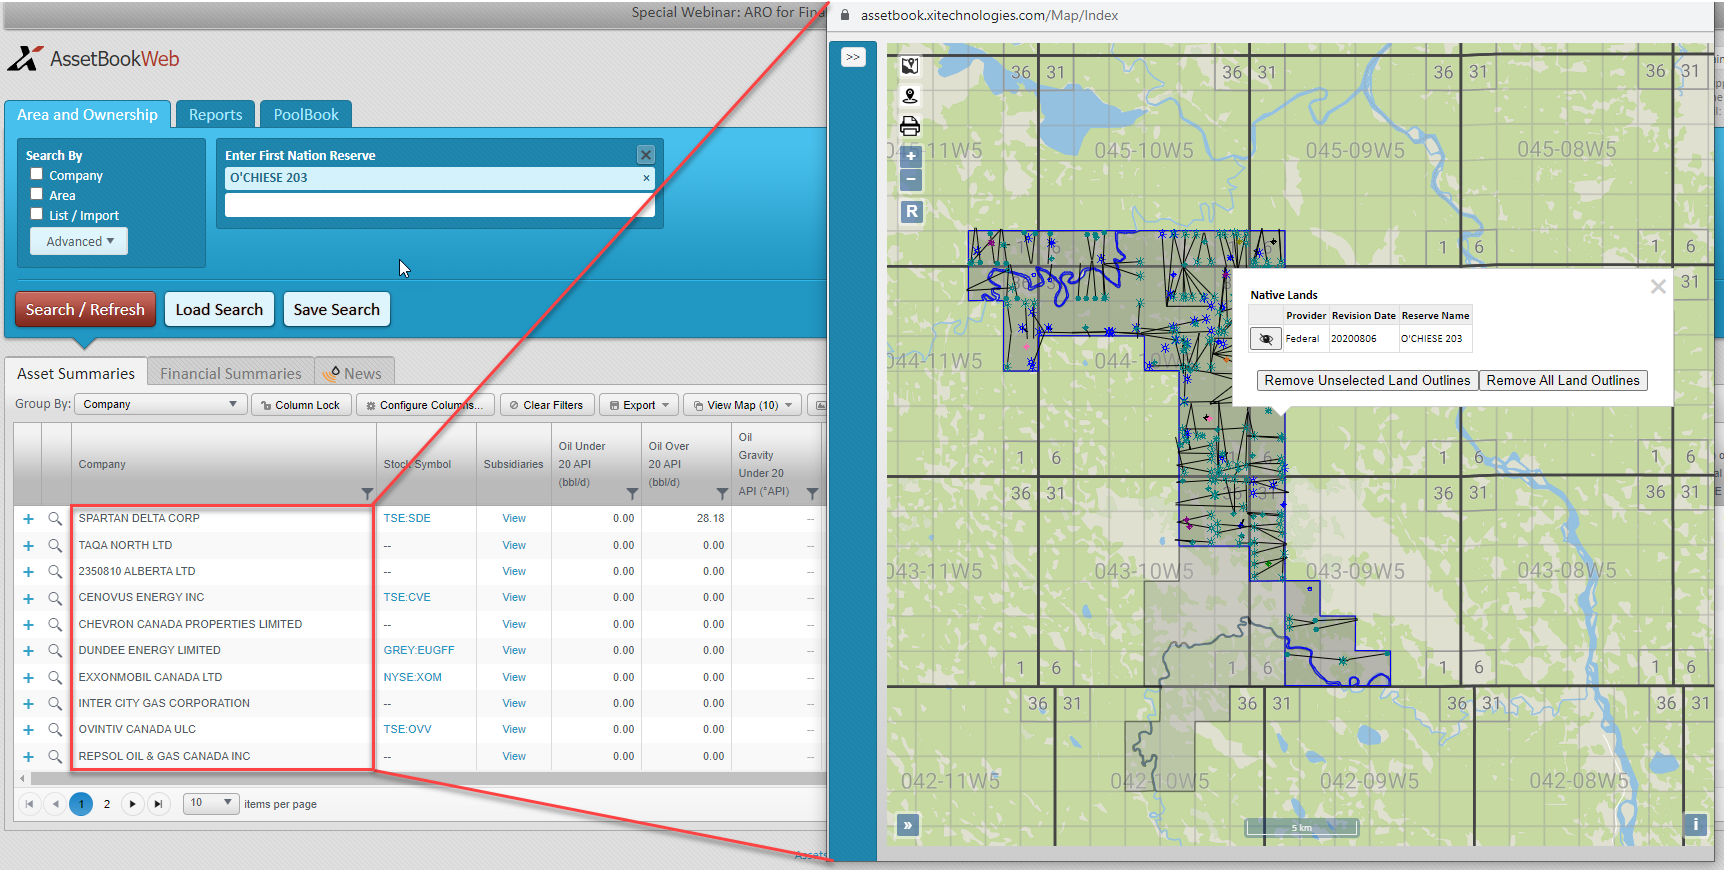
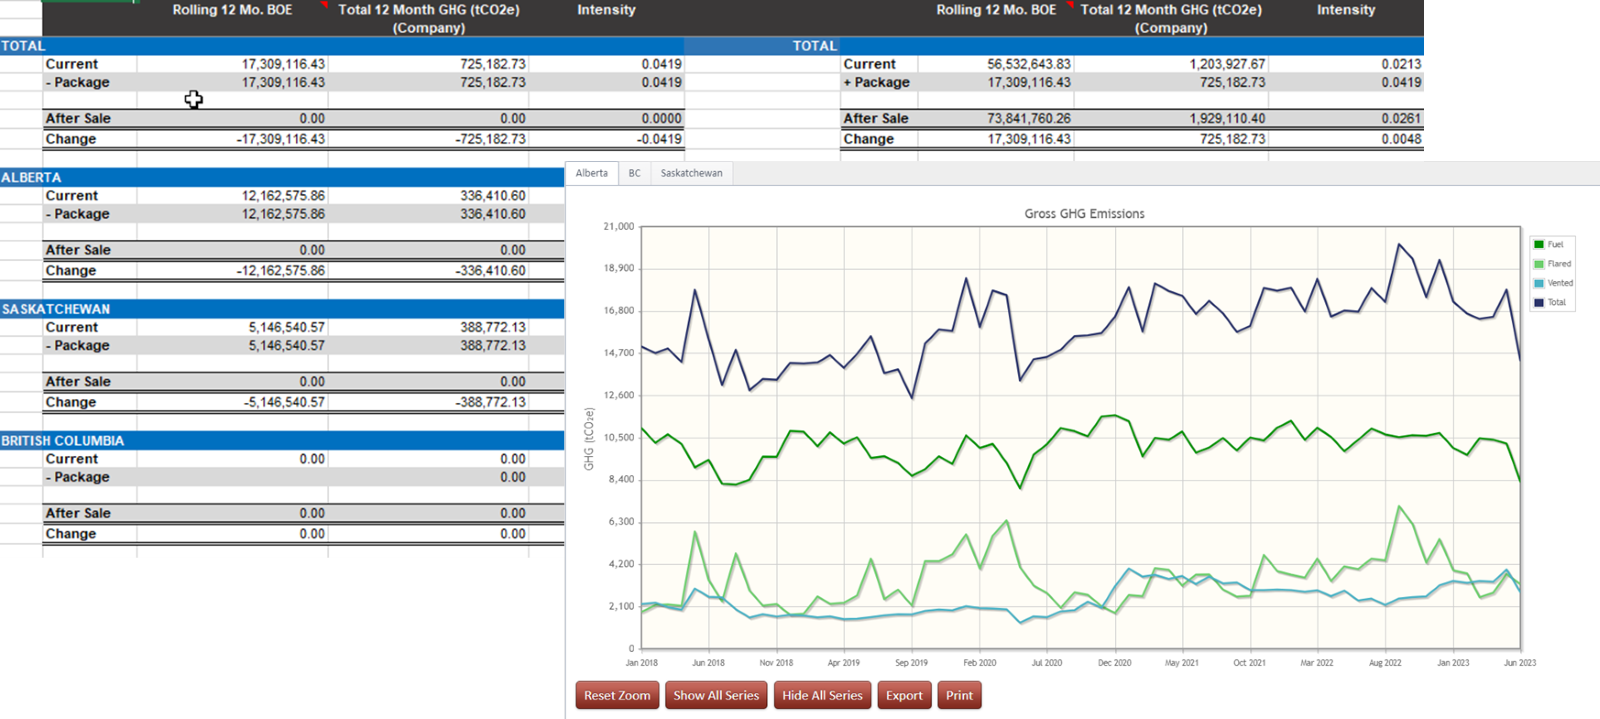
Figure 2: First Nation Search and Map Layers. - Carbon Sequestration and Storage Overview (with Panel Discussion) – Greg Owen from GLJ, discussed some of the concepts surrounding CCS and how companies can benefit from being strategic in this area. Carbon capture becomes more critical as governments begin to regulate this area more. Being able to look over the fence to see what emissions are associated with a potential deal becomes a strategic advantage. XI has developed an Emissions Report which calculates Scope 1 emissions for any company or area. Using government data, you can understand total GHG volumes and weights. There were 2 other panelists: Patricia Mroch from Skoki Energy Advisors talked about Canada’s advantage, and Stephen Arseniuk from Pathways Alliance (an alliance between major heavy oil producers) who focused on collaboration.
Figure 3: Pro-forma Emissions report and historical monthly fuel/flare/vent data. - CALEP Talks:
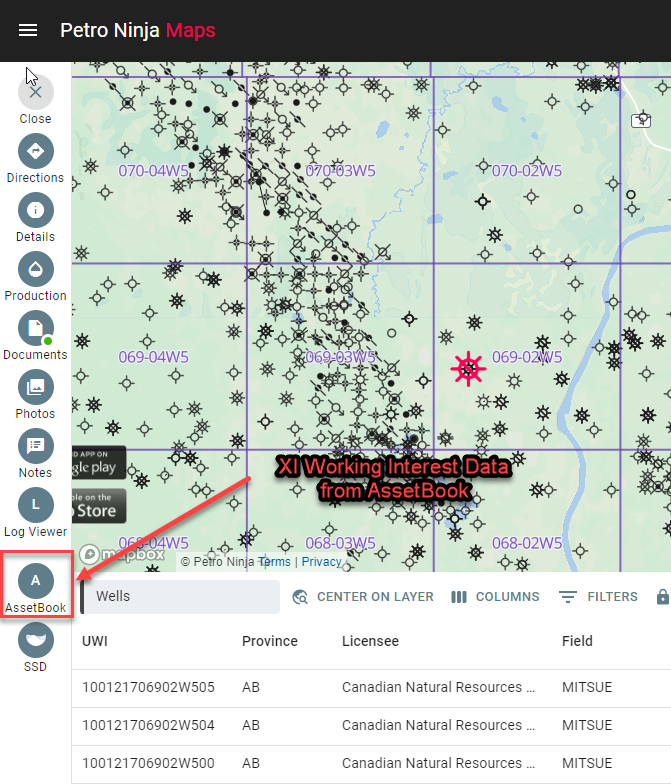
Dan Rutherford of BOE Intel adeptly explained how PetroNinja and BOE Intel are displaying data in a unified way to provide some very useful workflows for landmen, giving them the ability to query data and visualize on the map or through charts/graphs quickly and easily. Currently, users who are clients of both PetroNinja and AssetBook can integrate XI’s working interest data into their queries. Both products aim to help users make better decisions through concise summaries/visuals of public data. Whether you start with a map in PetroNinja or start with a query in AssetBook, working interest is key so stay tuned for more integration between the two systems!Figure 4: XI Integrated Working Interest Data within PetroNinja.
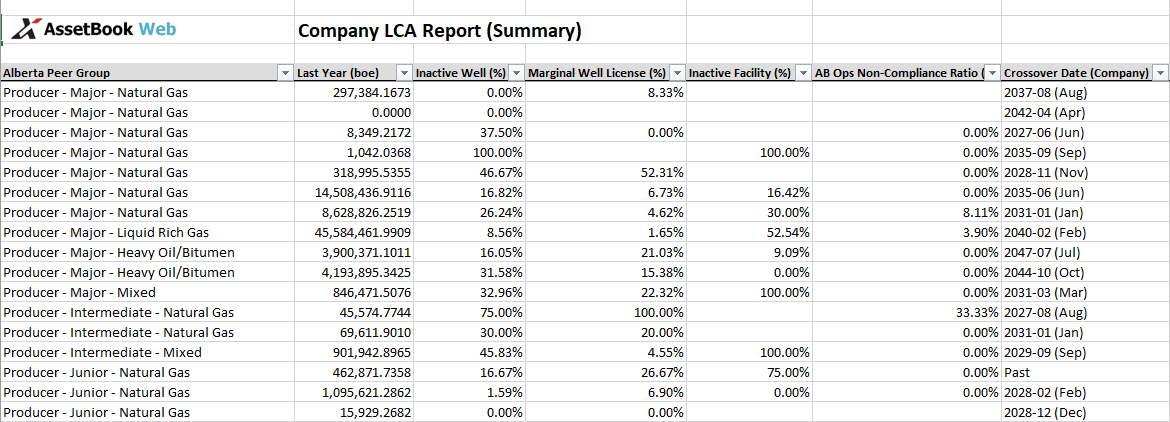
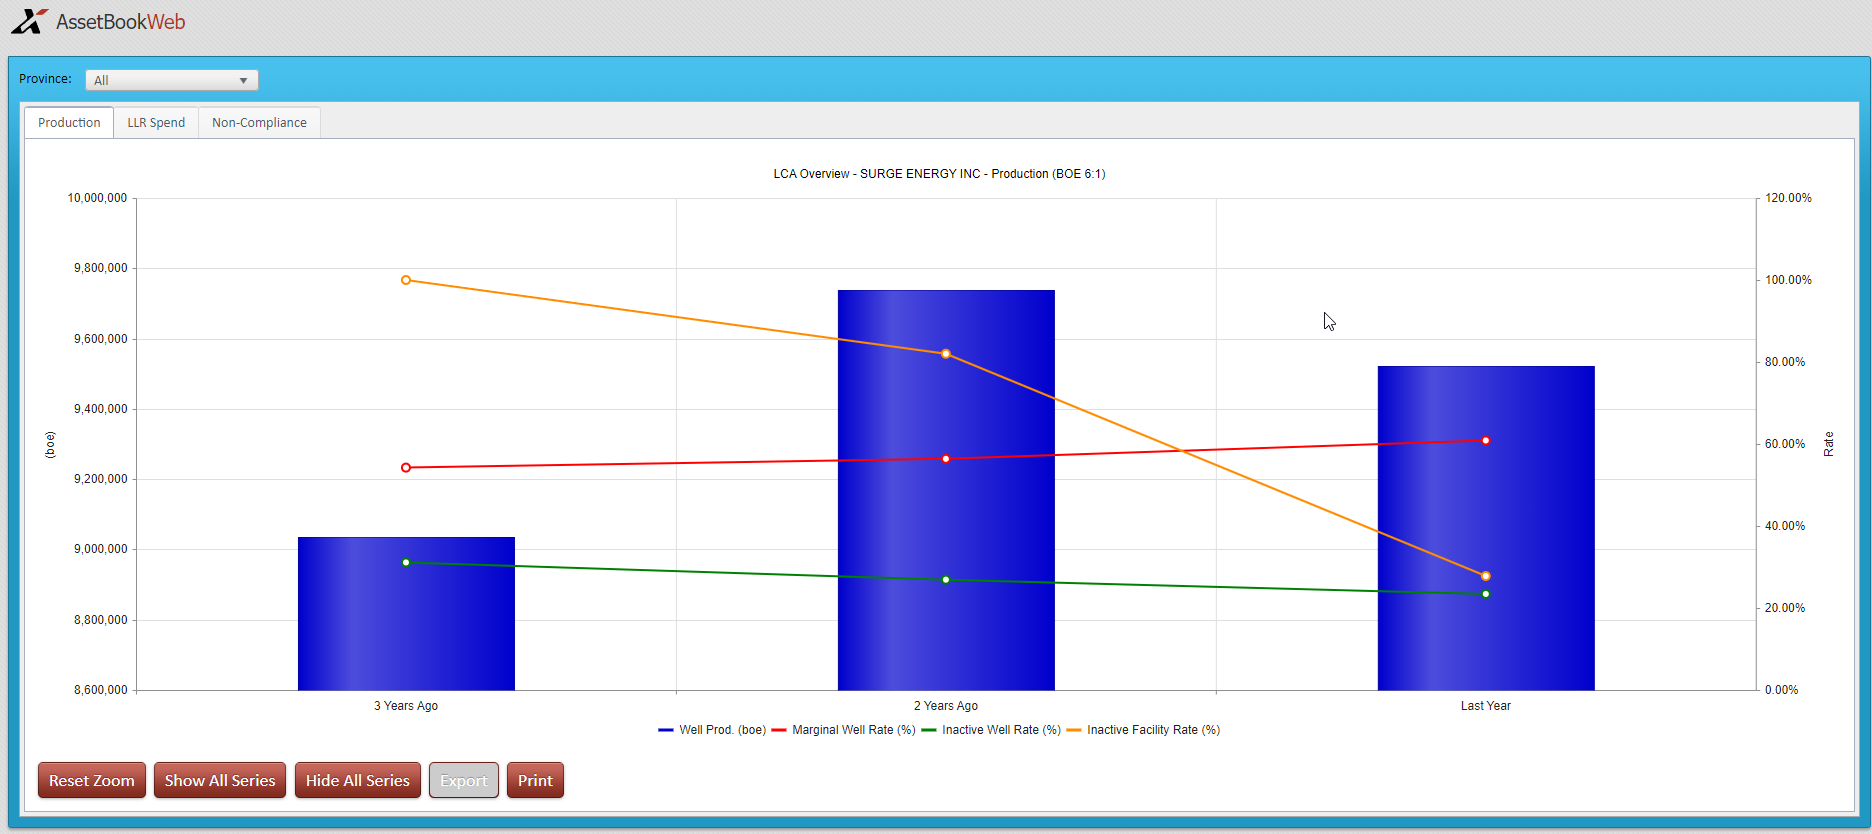
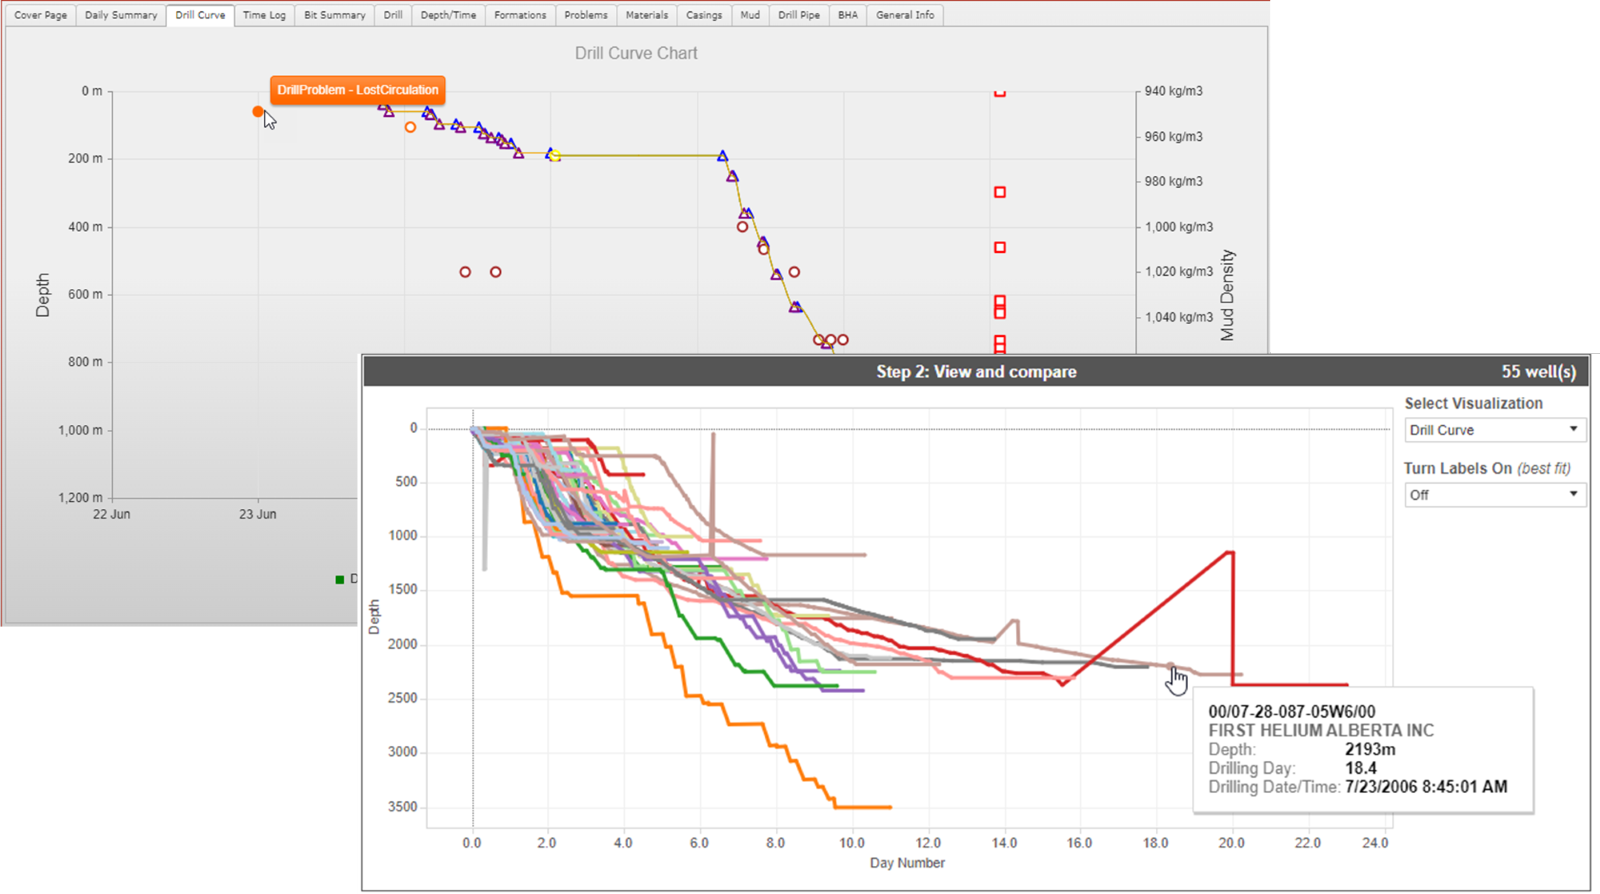
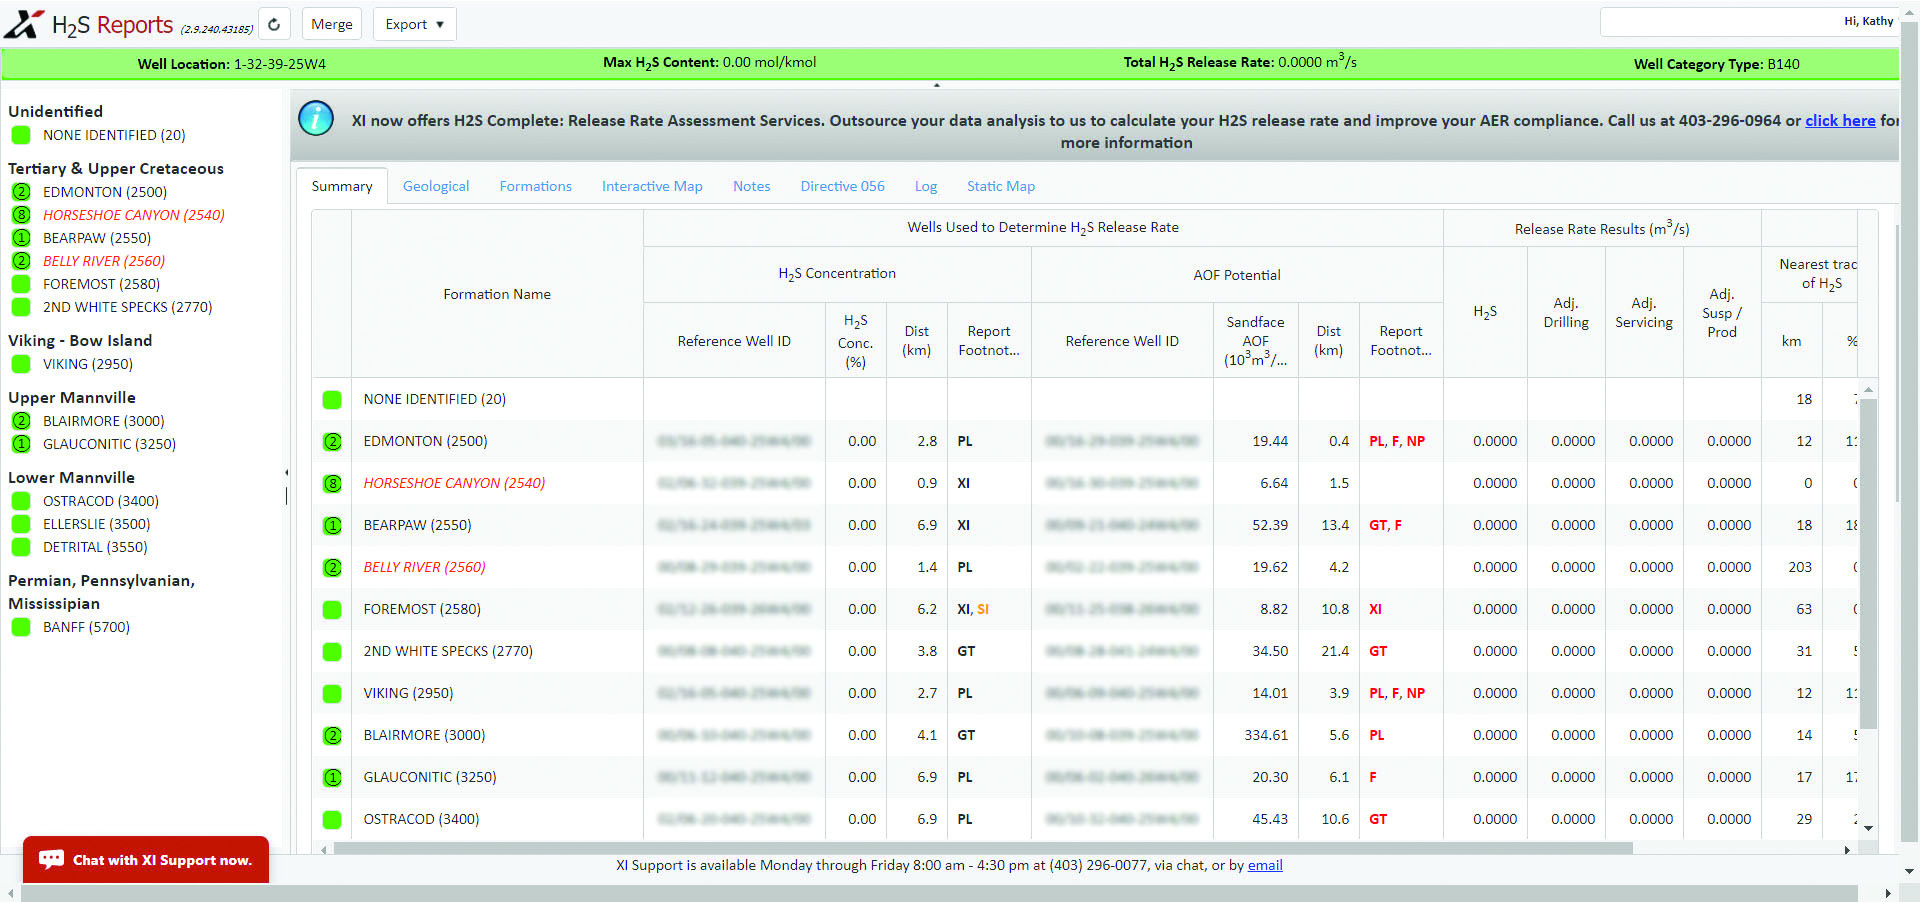
Mike Newton of 360 Energy Liability Management gave a great summary of the most recent changes to AER directives around liabilities and Directive 88’s holistic approach. XI has built several reports that specifically highlight the information the AER is using to classify and grade companies to determine how easily they will be able to transfer well licences.Figure 5: LCA Report to provide you with some estimated Directive 88 information. Figure 6: Sneak peak of one of our upcoming LCA Graphs to visually display Directive 88 information. Figure 7: Generate a Single Drill Curve showing Mud Density, Bit Changes and Drill problems, or have the option to generate a Multiple Drill Curve comparison.
Jesse Griffith/Helium – While the assumption might be that traditional oil and gas companies don’t need to pay attention to some of the developments in this space, we learned that there are more similarities than differences in terms of how Helium is extracted and monetized. XI has the ability to comb through massive amounts of data to help identify potential areas for Helium. Our Offset Analyst can identify pace setters and problem wells and allows you to view digital tour data on over 200,000 wells.
- Lost Art of Critical Thinking – Brett Wilson was, as always, entertaining and thought provoking. Back when he was at First Energy, Brett and his team were avid AssetBook users. Yes… this was back in the day when it was an Excel workbook delivered quarterly by CD!
As the energy industry evolves, XI is proud to support CALEP moving forward. Given our growth in data, development, expertise and education, it is our mandate to continue to serve this organization and the industry at large. We look forward to collaborating on the 2024 CALEP Conference in beautiful Banff Alberta!
Join one of our TWO upcoming sessions to learn more about AssetBook:
- WEBINAR – Tuesday, October 3
Time: 10:00 a.m. MT
Where: Zoom – Register here
- LUNCH ‘N LEARN – Thursday, October 12
Time: 10:00 a.m. MT
Where: XI Technologies Calgary Office – Register here
If you’d like to learn more about how XI’s AssetSuite software can analyze companies, packages, or regions throughout Western Canada, visit our website or contact XI Technologies.
Each week, XI Technologies scans its unique combination of enhanced industry data to provide trends and insights that have value for professionals doing business in the WCSB. If you’d like to receive our weekly Word to the Wise in your inbox, subscribe here.
Merger and acquisition (M&A) activities continue to dominate the headlines, and companies are finding the current market conditions generally favourable to expand market share through strategic acquisitions.
One such example is the recent acquisition of Ridgeback Resources Inc. (“Ridgeback”) by Saturn Oil & Gas Inc. (Saturn).
On January 20, 2023, Saturn announced their acquisition of Ridgeback for $525 million.
We’ve looked at both companies through a few different lenses using our AssetSuite software tools, that allow you to compare the companies and gain some insight of your own regarding this deal.
While both companies are light-oil focused, this corporate purchase is interesting as Saturn is purchasing the bigger entity of Ridgeback as well as diversifying into a larger gas base, with Saturn’s proforma production increasing by approximately 140%. For gas weighted production, Ridgeback is closer to 40% gas vs Saturn’s 10%. The most interesting aspect of this deal is that Saturn has been operating as a pure play light oil Saskatchewan producer, and this acquisition diversifies their portfolio across the WCSB, with new core areas in Alberta.
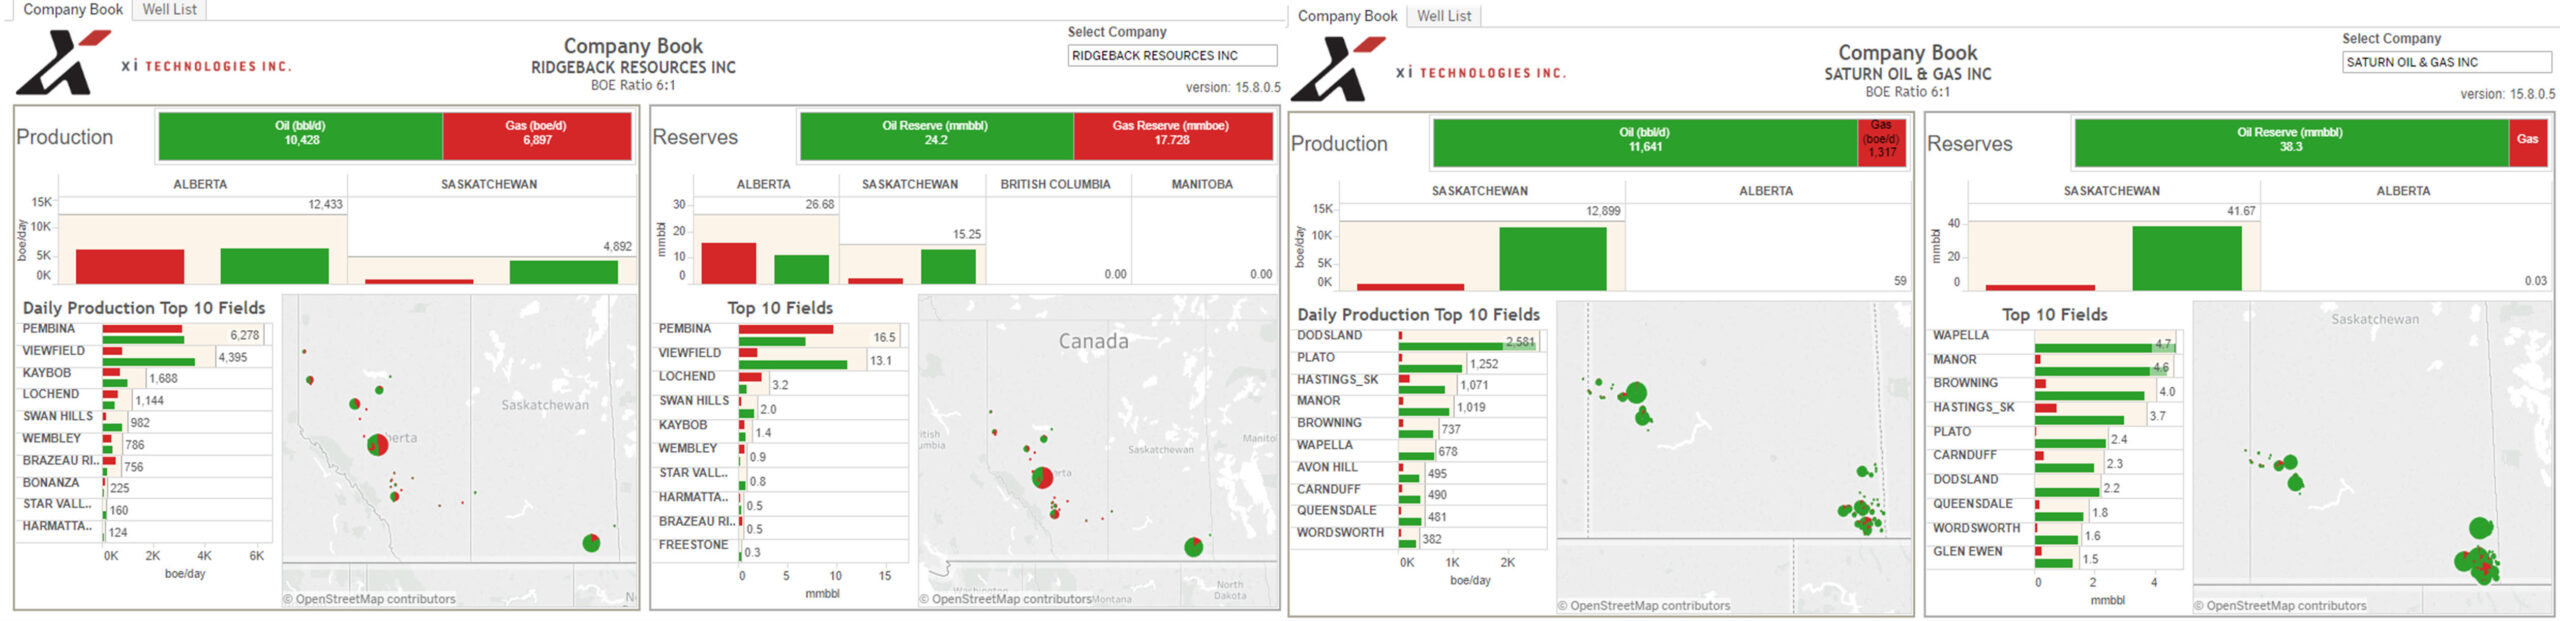 Figure 1 – Company Book for Saturn and Ridgeback
Click below to download a copy of
Looking at a map of the well assets, you can see that Ridgeback has a more diverse portfolio in terms of location of their assets, with SE Saskatchewan being the main area of significant overlap.
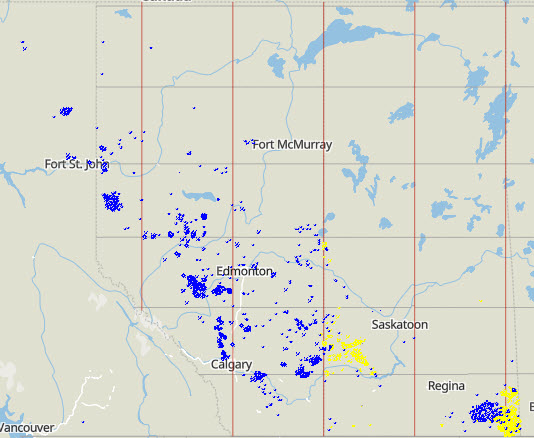
Figure 2 – Well assets of Ridgeback (blue) and Saturn (yellow)
Core Areas
Looking at the core areas of this deal, we see two things; the region of Sask Area IV becomes 41% of the new company, which was previously 58% of their total production, and the Alberta field of Pembina (Cardium) makes up a full 20% of the new company. Southeast Saskatchewan has many players, with Saturn and Ridgeback being among the top ten companies in this area as seen in the image below.
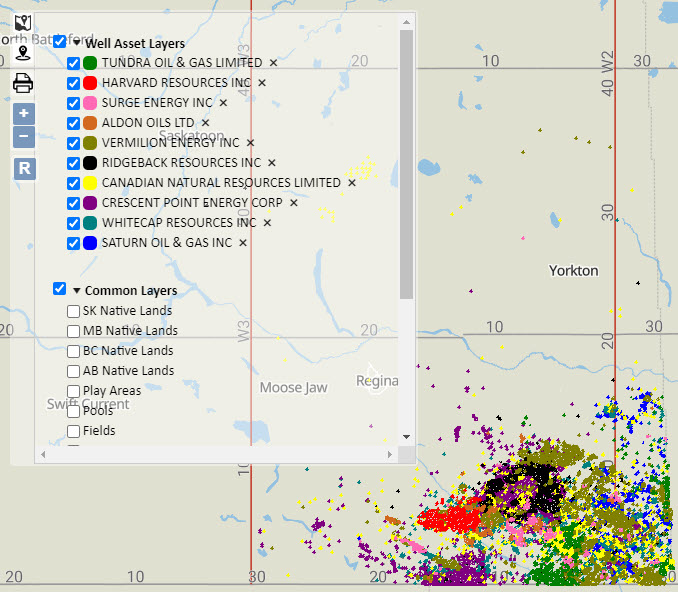
Figure 3 – Top 10 companies in Sask Area IV
Saturn has been much more active in this area than Ridgeback, with 24 net wells drilled as opposed to just one for Ridgeback in the past 12 months. Ridgeback has been more focused on Pembina in the last year with 9 net wells drilled in that Field.
Creating a merger book gives us an opportunity to view the new company holistically and see their new core areas. We can also understand where there may be some fall out properties from the deal that could be an opportunity for another company to purchase. Saturn’s press release announces their intention to leverage high quality light oil assets, maximize free cashflow to reduce indebtness, and to continue evaluating various opportunities, so future deals including divestitures may be upcoming.
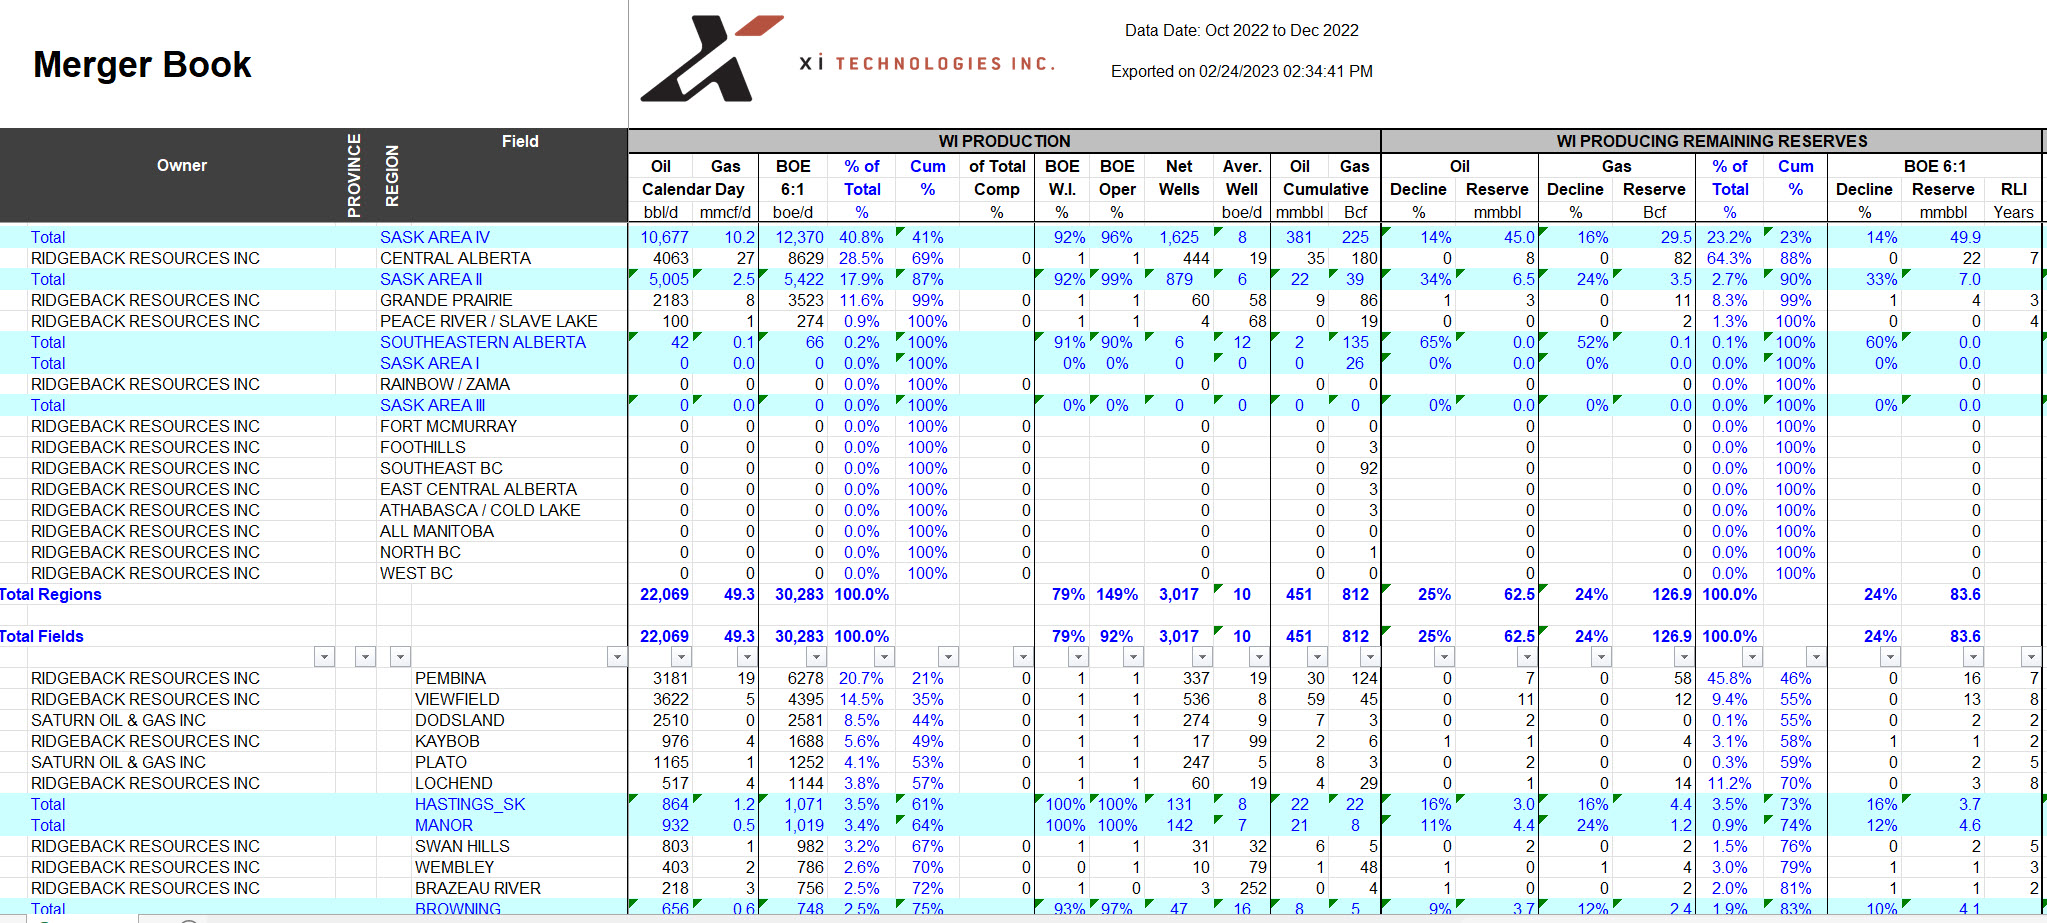 Figure 4 – Merger Book
Click here to download this Merger Book
Liability Overview
The ARO for the new company using XI’s cost model, this liability is slightly higher vs our best estimate of the assets involved in this transaction using the Government LLR Cost Model values. The Government model shows a working interest liability of approximately $440 million.
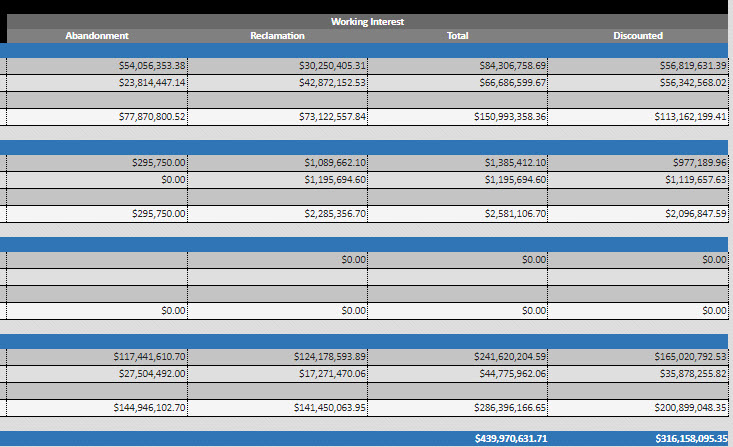
Figure 5 – Figure 5 – Working interest liability, total and discounted using Government LLR Cost Model
Using the AssetBook Emissions Report to take an over–the–fence look at the pre-acquisition emissions portfolios of both companies as well as a proforma estimate (TTM), SE Saskatchewan light oil–focused Saturn has a significantly higher Emissions Intensity, estimated to be in the 0.059 range, whereas Ridgeback is significantly lower, in the 0.027 range. The estimated proforma Emissions intensity of the new company is in the 0.041 range.
| BOE (TTM) | Scope 1 GHG (tCO2e, TTM) | Intensity (tCO2e/BOE) | |
| Saturn Oil & Gas | 4.524M | 271K | 0.059 |
| Ridgeback | 6.570M | 175K | 0.027 |
Estimated BOE (Trailing 12-month total), Scope 1 GHG (Trailing 12-month total), Intensity, pre-transaction from AssetBook Emissions. Saturn and Ridgeback have not published emissions figures.
For more results, or if you would like to learn more about how XI’s AssetSuite software can analyze potential mergers, acquisitions, and opportunities, including examining potential liabilities and emissions, contact XI Technologies.
For Immediate Release
XI Technologies welcomes Tamara Ritzel as they elevate their account management service.
Calgary, AB, February 6, 2023 – Calgary-based oil and gas data and software provider XI Technologies Inc. (“XI”) announced today the appointment of Tamara Ritzel as Senior Account Manager to oversee client needs and services.
With over twenty years of account management experience and a full network of industry connections, Tamara comes to XI excited about taking the role to the next level. “I’m passionate about building long term business relationships based on trust and respect,” she says, adding, “The oil and gas industry in Western Canada has been my home since 2005 where I have worked with software and data companies that ranged in size from small start-ups to large global enterprise solutions. Now, at XI Technologies, I can help my clients ‘find a better way’ by providing must-have solutions that are fast, efficient, and equally trusted.”
The role’s focus will be on the AssetSuite of tools for A&D prospecting and risking, strategic business planning, corporate benchmarking, Liability analysis (LLR/LCA), Asset Retirement Obligation (ARO) management, and emissions analysis. Drilling and regulatory tools will be added to the portfolio in the near future.
“Ensuring our clients have the very best software and tools for understanding asset data is our passion, our niche, and our industry reputation,” says Jennifer Baerg, VP Business Development for XI Technologies. “We are already known for our client focused approach to product development, training and support, but adding an exceptional senior account manager like Tamara to our team is part of the plan to elevate our overall client experience even further.”
For more information on AssetBook, ARO Manager, LLR or any other module within the AssetSuite, click here to view our offerings.
About XI Technologies
XI Technologies provides the data driven solutions that Canadian energy companies need for informed decision making, competitive analysis, A&D scoping, asset planning, business development, liability management, drilling, operations, regulatory compliance, and risk management.
The role of land and energy professionals is changing.
Gone are the days where landmen could do deals over drinks or at lunch, hammered out on a few napkins, and settled with a handshake. Today, you must seek out all the variables of the deal: from liability concerns to indigenous landowner issues to ESG concerns.
It’s still a relationship business, but one that demands that those involved have the right information at the right time. The question is, do you have the data you need? Can you provide your organization the information they need to make the best decisions possible when it comes to deals?
We invite you to watch a recording of our XI Chat “The Changing Role of the Landman”.
This discussion, hosted by trained landman Jennifer Baerg, highlights the evolving demands on land and energy professionals and how XI’s software provides the information their companies need. Included is a demonstration of the liability, indigenous boundaries, and emissions data available in XI’s AssetSuite.
Each week, XI Technologies scans its unique combination of enhanced industry data to provide trends and insights that have value for professionals doing business in the WCSB. If you’d like to receive our Wednesday Word to the Wise in your inbox, subscribe here.
Last week, after a couple postponements and an organizational rebrand, the newly-named Canadian Association of Land and Energy Professionals (CALEP, formerly Canadian Association of Petroleum Landmen – CAPL) hosted its 2022 CAPL Conference in Edmonton. This was an opportunity for industry leaders to step back and assess their changing role in an ever-shifting landscape.
From guest speakers like Cassie Campbell and Premier Jason Kenney, to various breakout information sessions, to the general tone and tenor of conversations throughout the conference, it’s clear that enthusiasm in our sector is running high. Current events have underscored the need for the safe, secure, and regulated energy that Canada provides. To meet the demands of this new era, landmen must continue to evolve to provide their organizations with the information they need, not only during the deal-making process, but also in other areas of the business.
Gone are the days where deals could be done over drinks at lunch, hammered out on a few napkins, and settled with a handshake. Today, Land and Energy Professionals have adapted to seek out all the variables of the deal: from liability concerns to indigenous landowner issues to ESG concerns. It’s still a relationship business, but one that demands that those involved have the right information at the right time.
Land professionals have known for years the importance of arming their organization with reliable end-of-life data for potential deals. Whether it’s the liability impacts of a proposed deal on vendors and purchasers, liability data for banks during credit redeterminations, or data for HSE and operations managers for planning and budgeting reclamation work, there’s plenty of demand for accurate liability costs from land professionals.
But the liability landscape in Western Canada keeps changing, forcing land professionals to stay on top of the current demands. The new Directive 088 in Alberta (or similar regulations being adopted in other provinces), increases the need for a complete picture of potential deals as provinces move away from simple LLR calculations to a more holistic view of corporate health throughout the energy development life cycle.
Joining liabilities as a significant topic of conversation throughout the conference this year was Environmental, Social, and Governance (ESG) concerns. To properly capitalize on the current reassessment of Canadian energy, it’s crucial that the industry positions itself to demonstrate its ESG bona fides, particularly in comparison to other volatile global markets. And while situations like the war in Ukraine have markets reconsidering the importance of social and governance factors, Canadian producers can’t let the lure of current commodity prices cause them to overlook the environmental concerns that had previously harmed their reputations.
Land professionals have a part to play here too, by examining ESG factors such as emissions data, freshwater requirements, and indigenous land rights prior to acquisition. Just as they’d adapted to the demands of liabilities, they now must expand their scope to emissions data, ESG considerations, and beyond.
The role of landmen continues to evolve, as reflected in the organization’s name change from CAPL to CALEP. But while the scope of information needed from Land teams continues to expand, it remains true that their role in providing data is an essential step in deal-making. And as the CAPL Conference “Canadian Tuxedo” night proved, building relationships is still a key factor for the role. As Canada’s energy sector adapts to new possibilities, land and energy professionals are poised to adapt their roles to meet these new possibilities.
At XI Technologies, we believe in arming land teams with the data they need, from land and production data users have come to expect and now with ARO, LLR, and Emissions data they’ve grown to need. To learn how we can help with “The Changing Role of Landmen”, register for our upcoming webinar by visiting this link. You can also visit our website or contact us for a demo.

![]()
Calgary, AB, April 7, 2022 – Calgary-based oil and gas data and software provider XI Technologies Inc. (“XI”) announced today the achievement of SOC 1 type 1 compliance for their AssetBook ARO Manager software module. ARO Manager is a tool that helps companies monitor and report their Asset Retirement Obligations (ARO) to manage end of life commitments for oil and gas assets. The module was granted SOC 1 type 1 compliance in March after a year-long application and rigorous inspection process by leading professional services firm PwC.
SOC (System and Organization Controls) is a certification standard that companies use to validate the trustworthiness of information providers. ARO Manager met this standard by proving that the application and XI Technologies has the appropriate controls in place – for both their business processes and information technology (IT) – to protect their client’s financial data.
“Ensuring our clients have secure, auditable processes has always been a foundational piece of ARO Manager,” says Amber Anderson, VP Operations for XI Technologies. “When our clients store their financial data in our system, they’re putting an enormous amount of trust in us, which is a responsibility we take seriously. So we were excited to work with PwC to verify our processes provided the assurance our clients deserve.”
In addition to SOC compliance, users of ARO Manager can satisfy their auditors and executives with other audit-friendly features such as automatically generated change logs and the ability to compare projects to reveal all changes from one project to the next.
Clients and prospects can request to view ARO Manager’s SOC report via request through XI Technologies.
For more information on AssetBook ARO Manager, visit XI Technologies website.
About XI Technologies
XI Technologies provides the data driven solutions that Canadian energy companies need for informed decision making, competitive analysis, A&D scoping, asset planning, business development, liability management, drilling, operations, regulatory compliance, and risk management.
2022 is shaping up to be the most active drilling season in years. Are you challenged by the various applications and directives necessary for obtaining drilling licenses?
To get a drilling license, operators must provide accurate, validated data that meets standards set for various directives. Cutbacks in drilling departments have reduced the expertise and understanding of applying for applications, leaving some unprepared or understaffed to properly achieve compliance.
RegulatorySuite from XI Technologies can help. Our tools deliver enhanced datasets and tools compiled from originally sourced government information and a step-by-step web application that guides you through process of pre-licensing research and applications.
Advantages of a guided process:
- Save time: Quicker workflow for AER Directive’s 008 and 056.
- Gain peace of mind: Recorded audit trail of work done.
- Eliminate redundancy: Do the work once. The software will remember your changes and you can apply them instantly to future reports.
- Collaborate easily: Transfer reports to colleagues with no more confusion over multiple versions. Audit trail still ensures accountability.
- Improve accessibility: Safe, secure web-based platform provides 24/7 access via any internet-connected device.
- Streamline efforts: H2SReports and XI’s SurfaceCasing Report share your changes allowing for quicker Dir 008 and Dir 036 compliance.
- Customize reports: Flexible exporting functions allow you to report and document your results.
H2SReport
Rest assured in the quality of data. With over two decades of experience in H2S Release Rate Assessments, XI provides the most reliable data to evaluate the potential H2S risks in your prospective locations. Calculate release rates that satisfy the requirements set by the governing provincial bodies and the Canadian Association of Petroleum Producers (CAPP).
H2SComplete
Don’t have resources to do your assessments in house? Have your H2S release rate assessment fully prepared and ready for submission by an accredited engineer at a lower cost and faster response time (3-5 days) than typical consulting firms. This cost-effective, turnkey service includes the analysis, validation, calculations, and documentation necessary to meet regulatory demands.
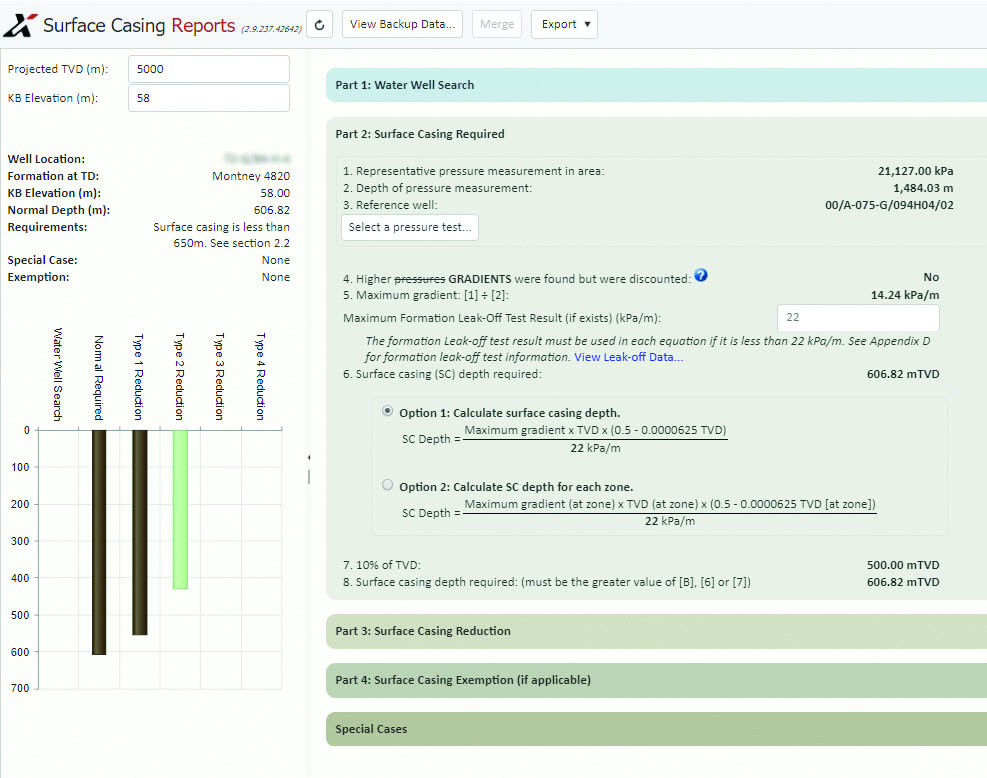
SurfaceCasing Report
XI’s SurfaceCasing Report makes it faster, easier, and less redundant to calculate your surface casing depth with location-specific data and software that guides you through the required steps. You receive the entire history of recorded tests and data in the vicinity of your location, to establish Surface Casing compliance, aid with STICK diagram completion, and determine proper well design.
Discover why companies actively drilling in the WCSB rely on XI Technologies data and tools to simplify their regulatory compliance and operate sustainably. Visit our website for more details or contact us today to learn how to get started with RegulatorySuite.