Sed diam nonummy nibh euismod tincidunt
Ut laoreet dolore magna aliquam erat volutpat. Ut wisi enim ad minim veniam, quis nostrud exerci tation ullamcorper suscipit lobortis nisl ut aliquip ex ea commodo consequat. Duis autem vel eum iriure dolor in hendrerit in vulputate velit esse molestie consequat, vel illum dolore eu feugiat nulla facilisis at vero eros et accumsan et iusto odio dignissim qui blandit praesent luptatum zzril delenit augue duis dolore te feugait nulla facilisi.
For years, XI Technologies has been dedicated to sharing knowledge we’ve obtained via our data and research in weekly posts we call XI’s Word to the Wise. As we conclude this year, we reflect on the most impactful articles that resonated with you and your peers, offering a trove of knowledge and analysis.
#1. M&A Snapshot – Crescent Point Energy Corp Asset Purchase
In a landscape shaped by geopolitical shifts and economic unpredictability, mergers and acquisitions (M&A) emerged as crucial strategic maneuvers. Against this backdrop, Crescent Point Energy Corp made a substantial move with the announcement of their $375 million acquisition of Kaybob Duvernay assets from Paramount Resources Corp. Our rigorous examination, facilitated by our advanced AssetSuite software, provided stakeholders with unparalleled insights into this transformative deal. XI’s reports, downloadable below, allowed for a deeper understanding of both companies, enabling a nuanced comparison critical for strategic evaluation.
Navigating through this deal required a multifaceted approach. Paramount’s recent Life Cycle Analysis (LCA) report, available for download, illuminated key trends, indicating a 5% production increase over three years. However, the report highlighted a substantial 54% inactive well rate compared to Crescent Point’s mere 5%, hinting at Crescent Point’s potential to strategically absorb these inactive wells. Furthermore, the LCA Report identified potential acquisition targets such as Spartan Delta, PetroChina, Ridgeback Resources, and HITIC Energy, highlighting low marginal well rates, low inactive well rates, and distant corporate crossover dates.
Download the Company Book for Crescent Point and Paramount, allowing you to navigate the core complexities of Paramount’s Duvernay assets, which constitute the heart of this transformative transaction.
#2. Blueberry River First Nations Area Overview
In June 2021, the BC Supreme Court delivered a landmark judgment in favor of the Blueberry River First Nations, affirming the violation of Treaty 8 rights due to years of industrial development in the upper Peace River region of northeastern BC. Fast forward to January of the following year, and a historic agreement was reached between the BC government and the Blueberry River First Nation. This agreement holds significance for the entire northeastern BC region, where various First Nations are Treaty 8 signatories. Covering approximately 38,000 square kilometers, the Blueberry River’s traditional territory is central to the implications of this accord. The deal marked a pivotal moment in addressing the historical impacts of industrial development on Indigenous rights in the area.
Exploring the top-producing companies within the Blueberry River claim area, as documented by XI’s AssetBook, Ovintiv, Tourmaline, ARC Resources, Canadian Natural Resources, and Petronas Energy emerged as major players, contributing 96% of the total production. The focus shifted towards environmental stewardship and remediation as a $200 million restoration fund accompanied the new agreement. With an emphasis on cleaning up liabilities, the region, hosting around 3,800 inactive licenses, carried an associated liability cost estimated at approximately $350 million, as indicated by XI’s 2022 Cost Model.
This remains one of our most-read articles well into 2023, and we continue to get requests for the downloadable report of all companies with a working interest in the area. Now you can also download our ARO Manager Project Overview Report.
#3. What Do Tax Pools Have To Do with M&A?
As the energy sector emerged from the pandemic-induced downturn, oil prices staged a robust rebound, prompting companies to cautiously revive shelved capital programs. Yet, a new challenge arose amid this resurgence: the intricacies of managing taxes. In Canada, businesses, especially in the energy industry, can leverage tax deductions and credits generated from capital spending on tangible and intangible assets. Tangible assets, such as equipment, can be deducted over time, subject to specific capital cost allowances. Unused balances offer the flexibility of deductions in subsequent years. In this climate, where strategic decisions can significantly impact a company’s financial health, understanding the nuances of tax pools becomes crucial.
In November, XI Technologies presented a comprehensive whitepaper, “The Tax Man Cometh – How Strategic Acquisitions Can Help Your Issue,” delving into tangible strategies and real-world examples that shed light on the timely consideration of tax pools in the context of mergers and acquisitions. It quickly rose to third place in our most-read articles of the year.
#4. Tourmaline Oil Acquires Bonavista Energy
Tourmaline Oil Corp’s notable $1.45 billion acquisition of Bonavista Energy Corporation intrigued industry observers. Leveraging our AssetBook, we dissected key players and regional dynamics. Our suite of tools, including the AssetBook ARO Manager, facilitated a comprehensive assessment of Asset Retirement Obligations, crucial for strategic planning. TAQA North Ltd. emerged as the dominant force, contributing approximately 38,000 boe/d of the 326,000 boe/d produced in the area. With 245 producers, the top 10 players hold a significant 63% share of production, underscoring the strategic importance of this predominantly gas-producing region, with over 80% of production sourced from gas.
For those keen on delving deeper into the dynamics of this acquisition, our downloadable information on the companies in this area provides invaluable insights. Additionally, as Bonavista boasts a substantial 71% working interest average, our AssetBook ARO Manager tool can be pivotal in assessing their actual Asset Retirement Obligation.
#5. Peyto Exploration & Development Corp. Acquires Repsol Canada Energy Partnership
In a burst of late summer M&A activity, Peyto Exploration and Development Corp (“Peyto”) revealed a significant move on September 6, 2023, with the announcement of its agreement to acquire Repsol Canada Energy Partnership (“Repsol”) for a sum of US $468 million. XI Technologies conducted a comprehensive assessment of the transaction, scrutinizing each company’s asset profile and the combined entity to extract valuable insights.
The A&D Workflow case study based on Repsol Assets is available for download.
We extend our gratitude to all our readers and subscribers who engaged with our content throughout this year. Join us in 2024 as we continue to provide in-depth insights through XI’s “Word to the Wise.”
For a deeper exploration of how our software can elevate your analysis of companies, packages, drilling data, or regions throughout Western Canada, visit our website or connect with us. Expect a year ahead filled with richer discoveries and deeper insights from XI Technologies!
Each week, XI Technologies uncovers trends and insights using our enhanced data and software focused on the WCSB. If you’d like Word to the Wise delivered directly to your inbox, subscribe here.
In the world of acquisitions and divestitures (A&D), navigating through a sea of opportunities requires a strategic approach to ensure that the chosen path aligns with corporate visions and objectives. Each company or individual might have their unique workflow, but incorporating certain key strategies can significantly enhance the efficiency and effectiveness of the process. Here are five tips offered by XI to maximize your time and effort while exploring A&D opportunities.
1. High-level scoping criteria:
Initiating the A&D journey demands a high-level overview to filter out opportunities that don’t align with your corporate vision. Criteria like production qualities, undeveloped land, non-core assets, and financial distress indicators from evaluations of financials or liability values are pivotal in this phase. This initial screening sets the stage for a focused exploration. Clearly outlining the criteria by which you would like to search for your target assets is critical to finding the right opportunity.
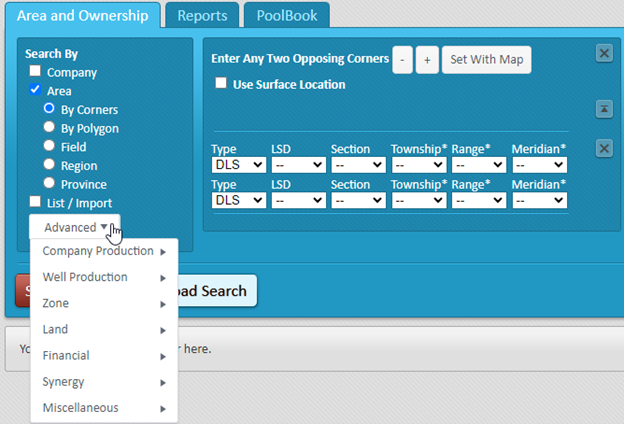
Figure 1: Example of some high-level scoping criteria. Source: AssetBook.
2. Production Profile and Land Analysis
Following the high-level investigation, delving deeper into the opportunity’s production profile and available land helps narrow down potential choices. Details regarding production statistics, well declines/reserves, operational nuances (such as operatorship, working interest percents, types of production, etc.), land expiry schedules, recent land sale prices, and other upside potential analysis play a crucial role in this stage. It is also important to look at area trends , such as land sale postings, and large shifts in ownership and drilling activity, to see if you’re going into a highly competitive area or one with a drastically changing landscape.
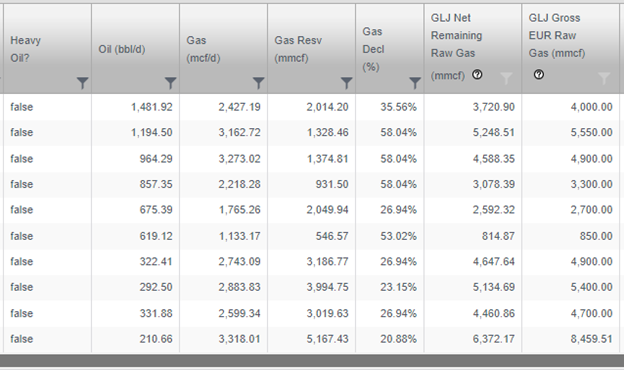
Figure 2: Example of an opportunitys production profile. Source: AssetBook.
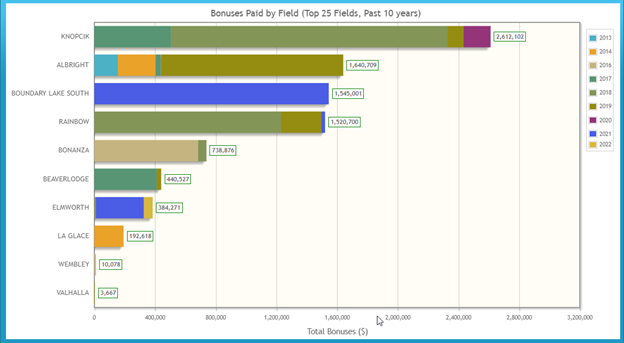
Figure 3: Total bonuses paid by field. Source: AssetBook Graphs Module.
- Evaluating Liabilities
Transitioning into a more serious evaluation phase involves assessing liabilities like LLR (Licensee Liability Rating), LCM (Licensee Life-Cycle Management), and ARO (Asset Retirement Obligation). Calculating post-transaction LLR for both the buyer and seller provides a clearer picture of your regulatory requirements and uncovers possible impacts with governmental bodies. Being able to estimate the impact of the deal such as changes to your position within your peer group or determining a possible inactive well ratio allows you to filter out those opportunities which may not be worth investing more time into persuing. Analyzing non-operator liabilities, variances using different rates, and scenario-based cost models for ARO further enhances decision-making and reduces the risk going into the deal.
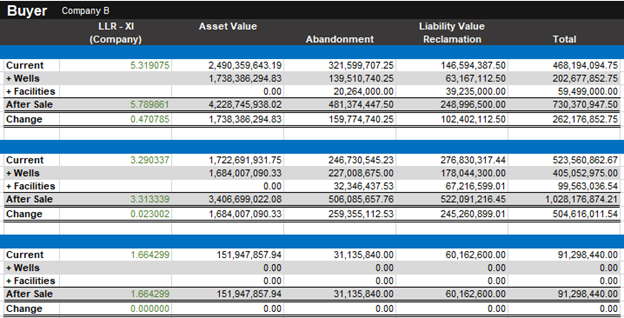
Figure 4: Example of potential deal in terms of liabilities and risk analysis. Source: AssetBook LCA Module.

Figure 5: Overview of companies liability impacts. Source: AssetBook LCA module.
4. Emissions Analysis
Considering the increasing focus on environmental sustainability, evaluating volumes and greenhouse gas emissions becomes imperative. Factors such as fuel flare vent, intensity effects, gas conversion rates, and regulatory commitments need detailed scrutiny to align with environmental objectives. A post transaction Emissions summary can easily be created for both the buyer and the seller.
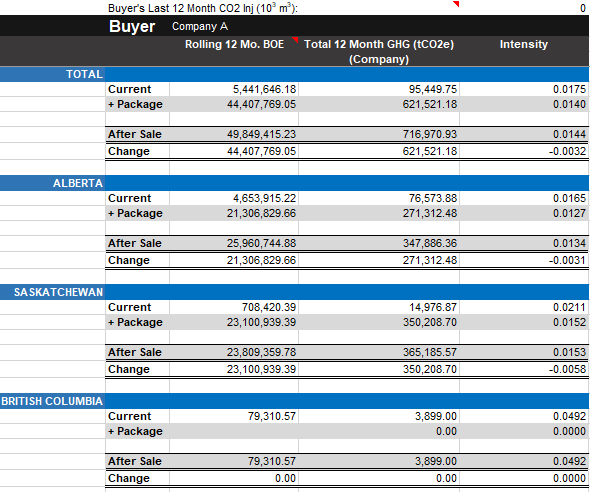
Figure 6: Post-transaction emissions summary. Source: AssetBook Emmissions Module.
5. Production Chain Evaluation
Lastly, scrutinizing the entire production chain completes the comprehensive assessment process. This involves mapping out the complete chain of production to market, analyzing efficiencies, identifying potential bottlenecks, and exploring opportunities for optimization. Being able to visually “follow the molecules” provides a deeper understanding of the business case for each opportunity.
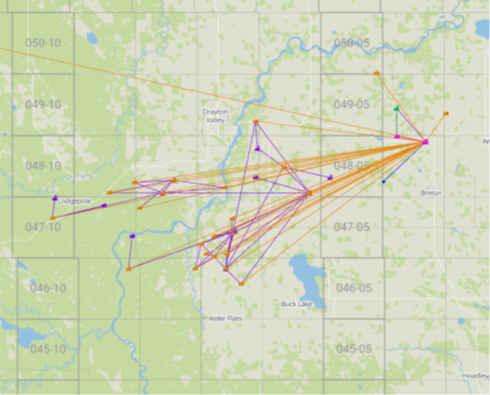
Figure 7: “Follow the molecule” wells to facility map. Source: AssetBook Production Chain Module.
In conclusion, a methodical approach to A&D opportunities that integrates these five strategies will quickly streamline the evaluation process. While every workflow may have its unique nuances, incorporating these first five steps offers a robust framework for maximizing the efficiency and effectiveness of the assessment phase in M&A endeavors.
For more tips and to learn about how XI’s AssetSuite software can help with your high-level analysis of potential mergers, acquisitions, and opportunities, including examining potential liabilities and emissions, click here.
Visit XI’s website and contact XI for a demo.
Each week, XI Technologies uncovers trends and insights using our enhanced data and software focused on the WCSB. If you’d like Word to the Wise delivered directly to your inbox, subscribe here.
Merger and Acquisition (M&A) activity has been rekindled recently, drawing attention to the pivotal role of comprehending working interest partnerships (WIP’s) in evaluating acquisitions or divesting asset portfolios. Nevertheless, in the realm of asset management, with working interest partners, certain critical elements might slip under the radar of your current workflow. Overlooking nuances could be the difference between seizing an opportunity or facing a potential missed opportunity, making it imperative to delve deeper into the intricacies of the data.
Uncovering Hidden Realities Through WIP Investigation Investigations:
Conducting a comprehensive WIP investigation might unearth unexpected non-operating partners who hold a stake in the asset you plan to acquire. Such revelations could significantly alter your perspective:
- Alignment of Interests: The asset may not align with the core business area of your working interest partner; opening avenues for direct discussions on your purchase of the asset.
- Strategic Collaboration: Leveraging an existing working interest partner for the new asset could offer additional value, such as access to facilities and pipelines.
- Identifying Competing Interests: Some WIPs might aim to augment their share, potentially transforming into competing bidders against your acquisition.
- Risk Evaluation: Identification of a troublesome or non-compliant WIP might steer you away from potential collaboration due to associated risks.
Directive Impacts on Acquisition Strategies:
Governmental scrutiny via directives like AER’s Directive 88, BCER’s PCA program, and updates in SK’s PNG025 program has intensified the need to understand WIPs, their compliance history, financial standing, and prior licensee affiliations. The amalgamation of Company Operator codes within and across the different government regulatory bodies remains a laborious task, highlighting the challenge of tracking asset ownership history amidst legacy data and code updates. However, this work is critical to understanding timelines and potential security requirements. Our LCA blog from two weeks ago discusses this issue in more detail.
Navigating Financial Stability of Partners
The 2019 Redwater decision by the Supreme Court of Canada accentuated the necessity of assessing the financial health of operated and non-operated assets. Any closure orders issued against a company undergoing bankruptcy or facing closure repercussions significantly impacts all associated WIPs, directly influencing budgeting and overall performance.
Strategies for Identifying WIP’s:
Efficiently identifying subsidiaries of a company, analyzing land ownership, and cross-referencing with well operatorship are crucial in unearthing potential working interest partners. Tools like the Synergy Report in AssetBook equip producers with a reliable means to assess working interest partnerships seamlessly, aiding in comprehensive evaluations.
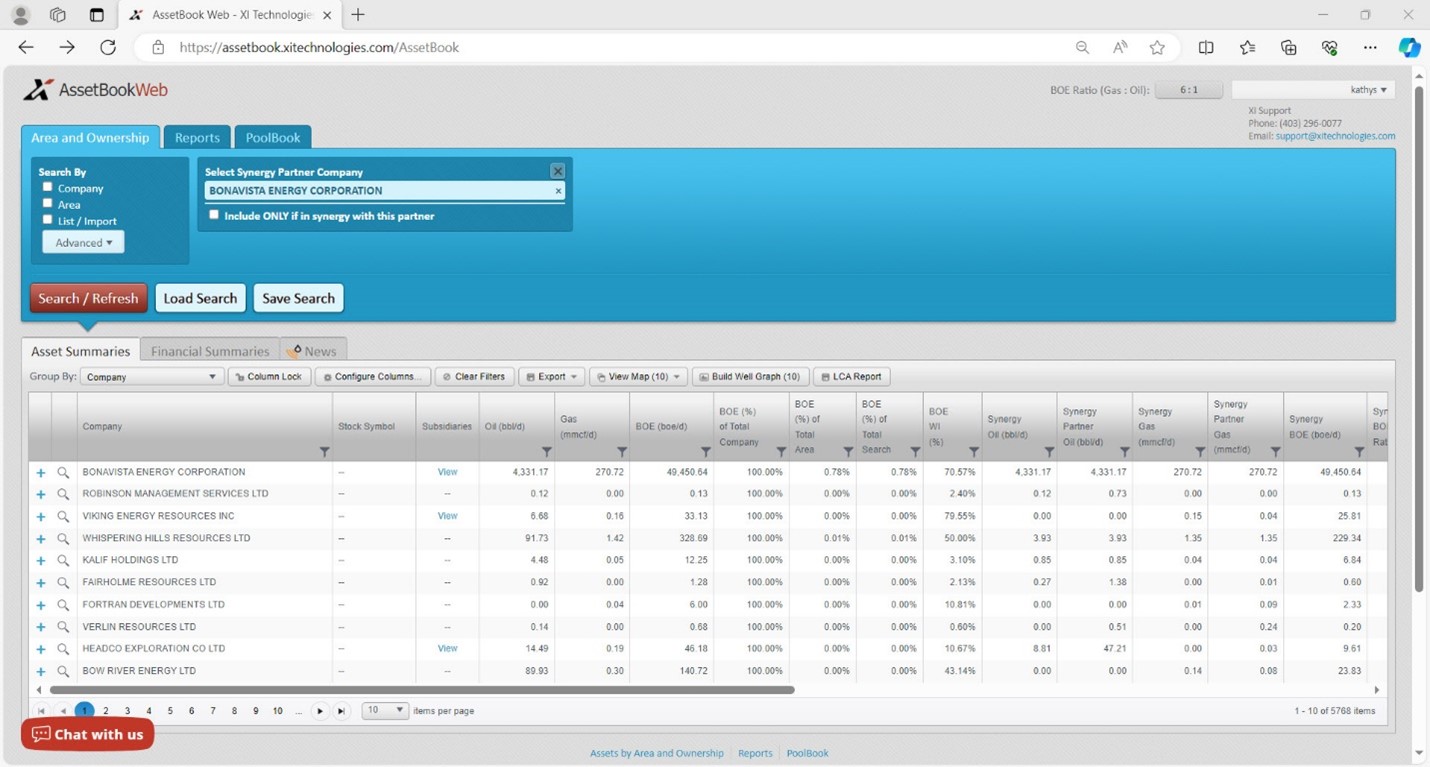
Image: Sample Synergy Report generated by AssetBook
For a detailed demonstration on creating a Synergy Report akin to the one displayed above, refer to this video tutorial. To explore how XI can streamline your understanding and management of working interest partners, reach out to us at sales@xitechnologies.com for an in-depth discussion.
Each week, XI Technologies scans its unique combination of enhanced industry data to provide trends and insights that have value for professionals doing business in the WCSB. If you’d like to receive our weekly Word to the Wise in your inbox, subscribe here.
Last week we discussed how Directive 88 may be affecting Junior and Micro companies (please find article here). In keeping with the trend of Major and Intermediate deals is the Crescent Point Energy Corporation’s (Crescent Point) purchase of Hammerhead Energy Inc. (Hammerhead). XI’s role is in providing data and software tools that help evaluate and scope for deals long in advance. Today, our M&A snapshot after-the-fact provides insights for your own evaluations that can be done without a data room and/or for finding “one-off deals.”
When assessing this transaction through different lenses using AssetSuite software tools, we see each company’s asset profile, plus the combined entity and gain valuable insight into the transaction beyond announced high-level acquisition highlights.
Deal Metrics
Crescent Point contributes 72% of the production to the combined entity. The companies are relatively similar in terms of operatorship (licensee on file) in that both have a high percentage operatorship, with Crescent Point at 96% and Hammerhead at 99%.
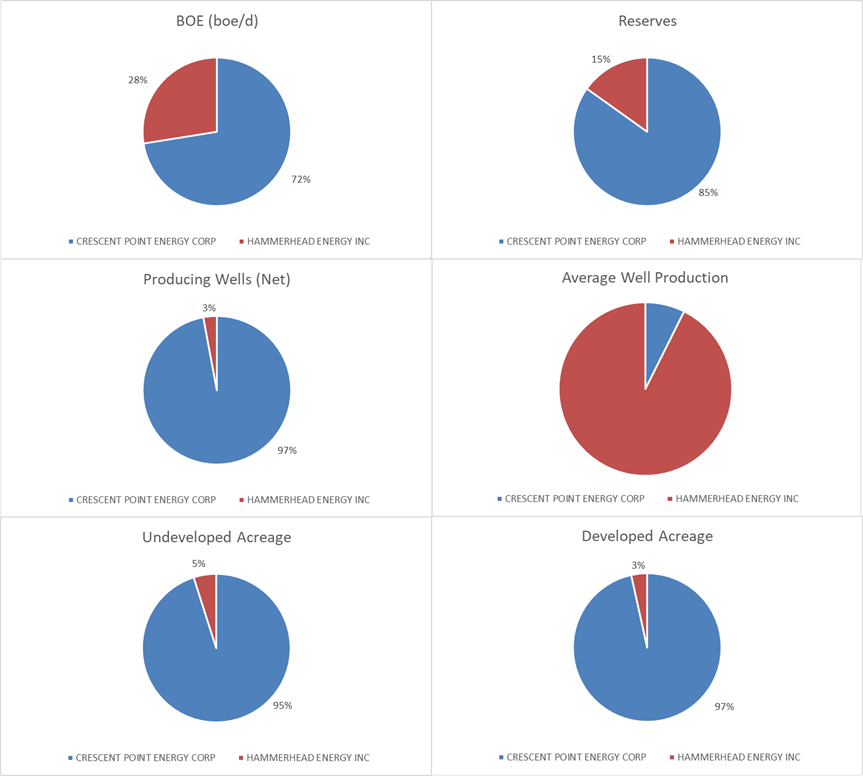
Figure 1 – Working Interest values for Crescent Point (blue) and Hammerhead (red). Source: AssetBook.
While the absolute numbers tell one story, accretion and dilution metrics tell us more. Looking at the AssetSuite summary, we can calculate some accretion and dilution metrics for this transaction relative to the increase in production.
Per Figure 2 below, this deal is largely accretive. Crescent Point’s production base grew by 38%, operatorship by 1% and working interest by 2%. There is a decrease in the BOE RLI which is to be expected and fits in Crescent Point’s balanced portfolio. These assets are meant to augment their high rate of return but shorter cycle assets in the Montney and Duverney play opposed to their long cycle Saskatchewan assets which will balance out these shorter life assets.
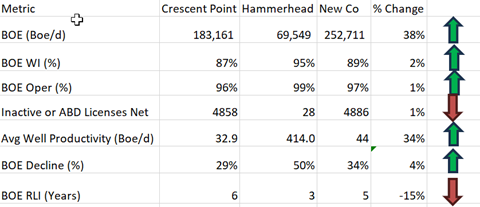
Figure 2: Deal Metrics.
Above numbers are based on three-month average to August production with raw gas numbers at a 6:1 gas to oil conversion. We recognize that Crescent Point’s Kaybob Duverney and Montney plays are likely in the oil phase of development at a different ratio. Source: AssetBook and ARO Manager.
As we can see, the contribution of inactive licenses did have a net negative effect, but very minimal given how accretive these assets are to Crescent Point’s portfolio.
Crescent Point is very spread out over the Western Canadian Sedimentary Basin however, this acquisition augments their recent strategy of moving into the Kaybob Duverney and Montney liquid rich assets that have a very high and quick rate of return. Crescent Point is primarily an oil company and while the AssetBook shows their production as 42% oil based on raw production from the well head, it is again important to note that their Montney assets are in the oil phase of development and therefore this ratio should skew closer to over 50% based on true boe production.
CORE AREA
Crescent Point mentions this transaction expands their core operations into their Montney play.
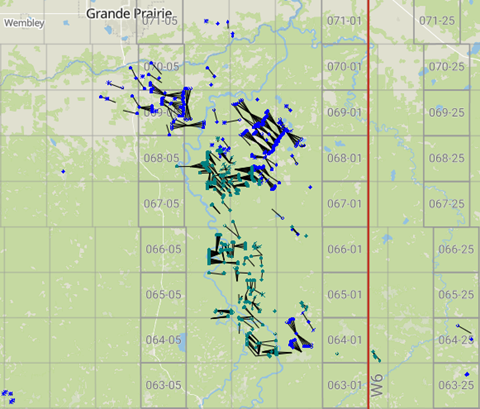
Figure 3 – Map of Crescent Point (Blue) and Hammerhead (Green) Core Area. Source: AssetBook.
This deal is primarily concentrated in the prolific fields of Elmworth and Karr (as defined by the AER). With the AssetBook we can create an area around these assets to see all other players that may be affected by this deal.
ARC Resources Ltd. (Arc) is the largest player in this area with approximately 108,969 boe/d of production. This area makes up 19% of Arc’s production. Notably, this area makes up 63% of Paramount Resouces Ltd.’s (Paramount) production falling in the top 10 producers of this area with approximately 91,161 boe/d.
There are 31 companies with ten or more boe/day in this area. Download more information on a full list of companies in this area here.
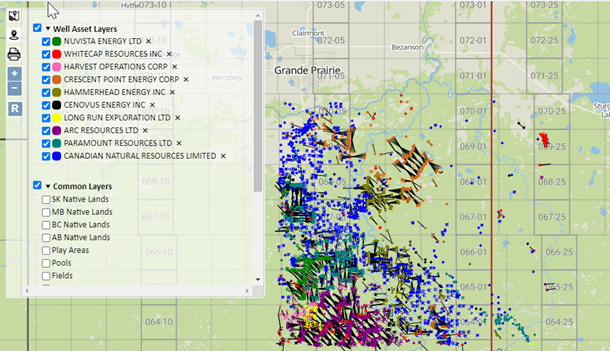
Figure 4 – Top 10 companies in Core Area. Source: AssetBook.
Liability Overview
As the AER is still looking at directive 11 for LCA liability costs and it is important to see the liability cost of the transaction we have used XI’s LLR module to evaluate this. Using an LLR analysis, this deal is slightly accretive to Crescent Point’s LLR ratio increasing it by 2.9. According to AssetBook’s LLR/LCA Module (which only accounts for licensed assets), Crescent Point will absorb $33,708,016 in deemed liabilities, all from Alberta. It’s worth noting that we are not privy to private Site-Specific Liability Assessments, and the deal does involve a number of large-scale facilities, including large scale gathering systems. The majority of the infrastructure is tied in to third party processing plants.
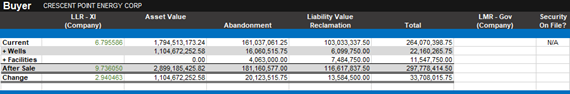
Figure 5 – LLR for Crescent Point, pre- and post-transaction. Source: AssetBook LLR Module.
This figure is slightly higher than XI’s ARO Module working interest calculations which indicates Crescent Point will absorb $33,124,899 in liabilities. As indicated by the very low number of inactive or abandoned liabilities, on a high-level glance, these are very clean assets.
Are there any Emissions Impacts?
While not always discussed as strategic rationale or mentioned in press releases, the emissions impact on the post-transaction entity can have notable implications, particularly form a carbon tax or credit perspective. This deal in particular has minimal overall impact on post-transaction Crescent Point but will bump up their XI-calculated 12-month trailing Scope 1 (fuel, flare, vent) GHG intensity 0.014 to 0.015. The majority of the GHG emissions comes from five Hammerhead facilities that produce ~20k tonnes CO2e or higher. These facilities, as well as a few others, may have TIER-related carbon tax implications.
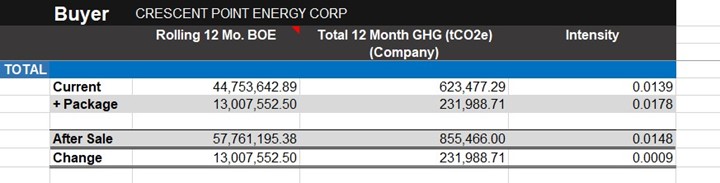
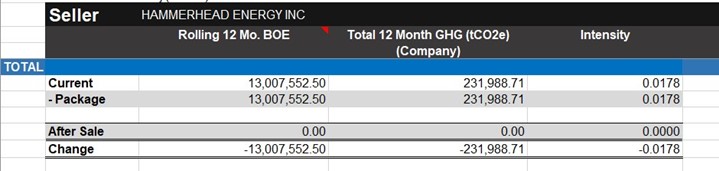
Figure 6 – Post Transaction Emissions Intensity (Scope 1: Fuel, Flare, Vent; TTM)
While analyzing deals after they are announced is interesting, tools that provide the leg up for looking at your own deals or finding deals proactively to create better value provide a significant advantage. For more results on this acquisition, or to learn more about how XI’s AssetSuite software can analyze potential mergers, acquisitions, and opportunities, including examining potential liabilities and emissions, click here
AssetSuite’s ARO Manager is the only standardized tool for estimating and monitoring asset retirement obligations in Western Canada’s oil and gas sector. To learn how ARO Manager can help with your planning and reporting of liability management, join us for our virtual information session.
Webinar: ARO Manager for Financial Tracking & Reporting.
When: Tuesday, December 5, 2023 @ 9:30am MT
Register here, or visit XI’s website and contact XI for a demo.
LCA and Transparency (Part 1)
Each week, XI Technologies scans its unique combination of enhanced industry data to provide trends and insights that have value for professionals doing business in the WCSB. If you’d like to receive our Word to the Wise in your inbox, subscribe here.
The Alberta Energy Regulator (AER) outlined a new framework in Directive 88 and the accompanying Manual 23 designed to incorporate a holistic approach to evaluating a licensee. It addresses five key areas; Licensee Assessment or Capability; License Transfers; Licensee Management Program; Inventory Reduction Program and Security Deposits. In this article, we will focus on the Licensee Assessment for License Transfers.
One of the repeated complaints we hear from stakeholders in the license transfer space (E&Ps, banking and investment, lawyers, shareholders) is the lack of transparency with pulling the data and recreating many of the metrics. In fact, accurate or not, banks and other lenders are currently still relying on the old LLR ratio methodology as it is much easier to base covenants on black and white, transparent numbers. The calculations behind the metrics, and available data are opaque, and most transactions trigger regulatory review, so why even try to figure it out? While much of this new Directive seems to fall into a “black box,” the AER has basically given an outline of what one should be evaluating when looking at a deal. During the transfer process once confidentiality agreements are in place the information the AER requires within this directive lines up with metrics used to properly evaluate a deal. These calculated values assist with enhancing your deal up front, exposing any potential cost obligations that may come up.
This November, our team was invited to host a talk in conjunction with Burnet, Duckworth & Palmer LLP (BD&P) at the PADA Society breakfast where we discussed this very topic. After an overview of Directive 88 from BD&P and an excellent discussion on how the directive was currently affecting the deal space, we presented ways to reverse-engineer the directive using public data to allow for a “peek beyond the black box” on the licensee capability assessment metrics.
The AER categorizes LCA into two groups: Risk and Performance. The Risk group includes evaluations for level of financial distress and magnitude of liability. The Performance category includes remaining lifespan of resources, operations, closure, and administration. The AER uses these factors to assign a company a licensee profile to group and prioritize producer licensees, as well as to identify regulatory and liability risks that will need to be mitigated by the licensee.
So how can you estimate each companies’ licensee profile and determine how long a deal may take to process? There is a wealth of public data available, and if you compile it in a specific way, you can calculate and estimate some of these factors, which can then help you adjust the structure your deal. For our purposes here, we’ll look at the Performance group, specifically, the “Remaining lifespan of mineral resources” factor, however if you would like to learn more about our take on the other factors and where to find the data, download our latest whitepaper here.
We have certainly seen a lot of M&A occurring within the Major/Intermediate Peer Groups, as categorized by the AER in Directive 88 (see Manual 23 – 2.1.2.1. Peer Group). The larger entities are likely at an advantage with more financing to back them – but what’s happening with the Juniors? Are they able to participate in any of these deals? Considering that a company’s mandatory spend (outlined in Manual 23, Section 4 – Inventory Reduction Program) is set around June, and doesn’t transfer with the licensees, they must somehow navigate through the perfect storm to fulfill their obligations and do the license transfer, all the while dealing with financing obligations and covenants with their lenders.
Let’s look at one area where companies can find information: the Remaining Lifespan of Resources. This includes the parameters of production trend, inactive well ratio, marginal well ratio, inactive facility ratio, and crossover timeline (Manual 23, Table 3). These categories will provide an insight into a company’s’ operational efficiency and will help you determine if the company is set up to fund its closure activities.
As an example of how to compare companies we look at three companies in the Junior Peer Group that have a high LLR Ratio based on the AER’s old calculation from Directive 11.
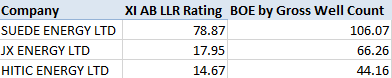
Figure: Three Junior Companies and XI Estimated LLR ratios.
Suede and HITIC are both increasing production over the last three years, and both seem to be lowering their inactive well count. Suede stands out in the fact that their marginal well (10 boe/d or less) from three years ago went from 100% to 18% now. The company that stands out when looking at cross over dates is JX Energy, with an RLI crossover date in 2043.
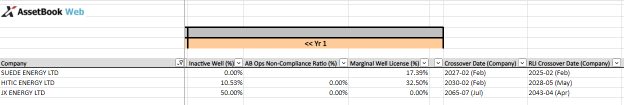
Figure 6: A portion of the LCA Report showing some calculated parameters based on the remaining lifespan of resources factors
If you want to see the full comparison for these three companies, download the LCA report HERE. You can also expand this and look at the top ten that rank based on these factors and see how they compare against the companies identified in our recent Tax Pools article.
All factors outlined in the new directive are important to consider, but the Remaining Lifespan of Resources factor really allows you to easily benchmark companies against one another, to quickly identify ones that you may want to research further. Once that’s done, you can take the next step to look at the other factors outlined in Manual 23, especially the magnitude of liability, and an estimate of your potential security deposit for the deal.
Stay tuned for Part 2 on this topic, coming soon.
For a more thorough review of all factors involved in a more holistic approach to evaluations, download our whitepaper Licensee Capability Assessment here.
_______________________________
AssetSuite’s ARO Manager is the only standardized tool for estimating and monitoring asset retirement obligations in Western Canada’s oil and gas sector. To learn how ARO Manager can help with your planning and reporting of liability management, join us for our virtual information session.
Webinar: ARO Manager for Financial Tracking & Reporting.
When: Tuesday, December 5, 2023 @ 9:30am MT
Register here, or visit XI’s website and contact XI for a demo.
Each week, XI Technologies scans its unique combination of enhanced industry data to provide trends and insights that have value for professionals doing business in the WCSB. If you’d like to receive our Word to the Wise in your inbox, subscribe here.
The end of 2023 is turning out to be highly active for mergers and acquisitions. But once a company has decided to merge with another (or purchase just some of their assets) – they have completed all the requisite paperwork, they have been approved by the Regulators, the banks, and the shareholders, and the purchase is complete – THEN what?
Shifting the assets from one company to another includes more than just submitting the paperwork to the appropriate governmental agencies, and then just sitting back and letting things happen. In this blog, we are going to focus on integrating the acquired assets into your ARO calculations.
Integrating the data into existing systems and processes often takes a back seat in priority, as operational integration tends to be the primary focus. After all, that’s where the money is going to be made. But integrating the data for ARO analysis and calculation should be just as important, as the overall company’s financial health can be adversely affected if bad information is passed on.
Corporations often manage their ARO calculations in complex spreadsheets, and while simply adding rows to an existing list doesn’t sound that difficult, it can cause real turmoil. Four questions we recommend you ask prior to starting your work:
- Does the information received include the data points needed in your spreadsheet?
- Is the information received full, accurate and complete? For example, working interest percentages may need to be cross-referenced with land documents to ensure accuracy, or statuses that have not been updated appropriately require a full check.
- How can you cross reference their spreadsheet with your work in a different format? UWI, License numbers and other data inputs are often changed on a company-by-company basis. Leading zeros missed in their spreadsheet can completely throw out information within yours.
- How can you easily identify missing pieces of information? While related to question number two, often what is important to your cost model or data set may not be to another company, so there could be significant gaps.
Duplicating efforts by maintaining legacy spreadsheets which are then brought into current processes wastes everyone’s time, and can lend itself to newly introduced errors, causing even more lost time searching for root causes.
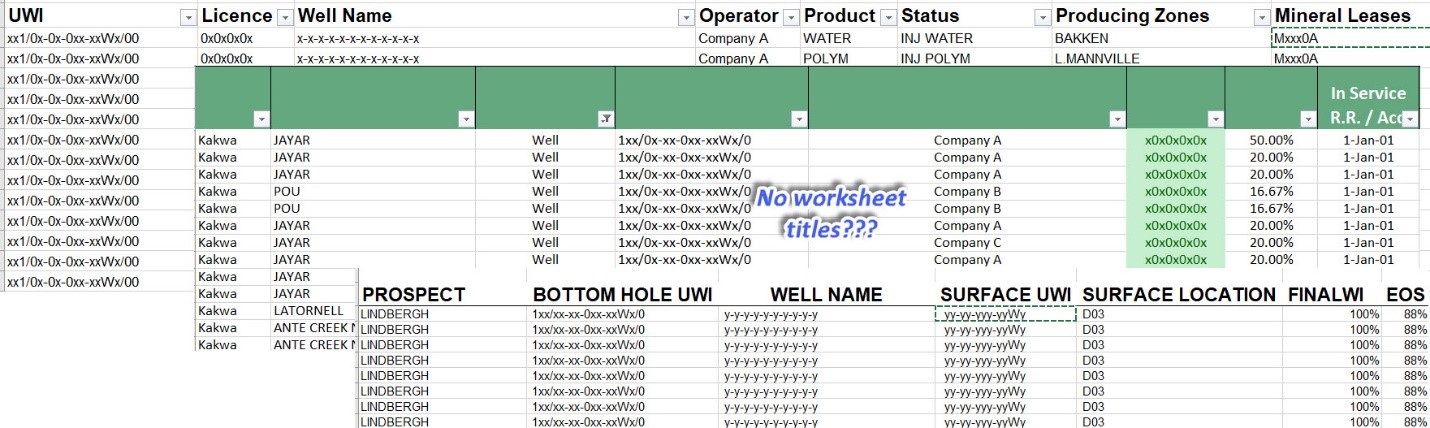
Figure 1: Example of multiple worksheets with varying data and formatting that need to be merged following an acquisition.
The solution, as we see it, seems simple, yet quite complex. Integration requires that you pull out the data you need and leave the data you don’t. There might be some validity to using that other data at some point, but initial integration should NOT include updating your current processes.
In our experience, those companies that proactively plan to integrate new acquisitions into their ARO projects have greater success immediately. The new data seamlessly flows throughout their finance and operations teams to allow for uninterrupted tracking and reporting.
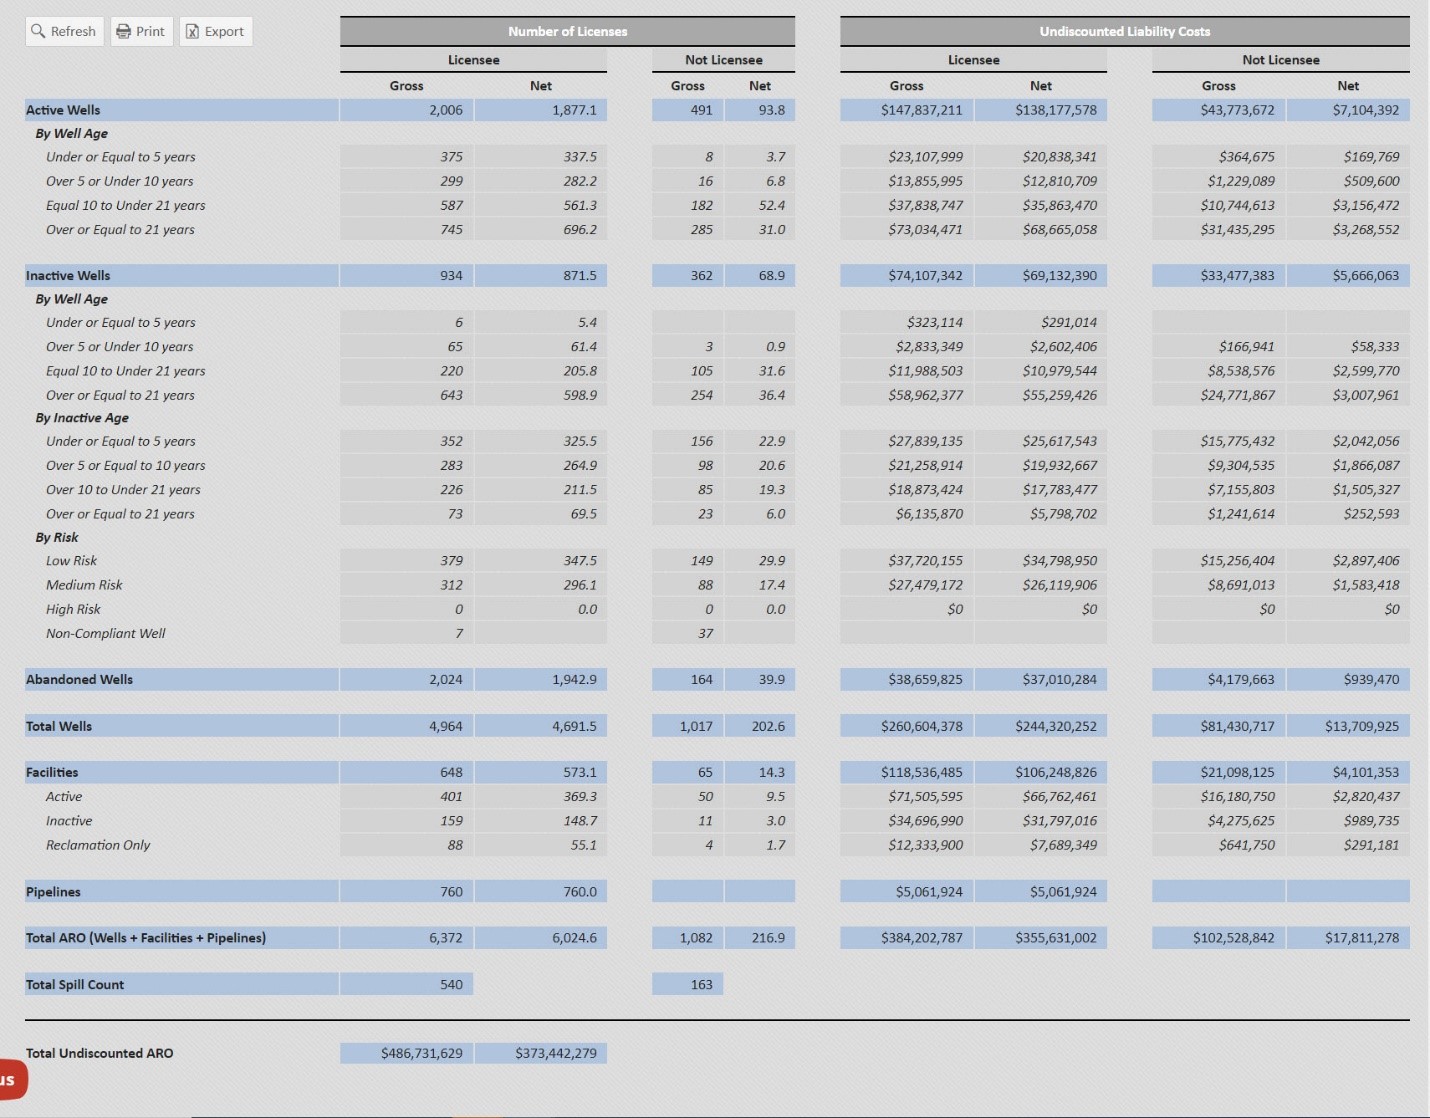
Figure 2: Project Overview from ARO Manager, the result of integration of all data into one master.
To ensure that no steps are missed during the integration, we’ve set up a checklist which we follow at XI with our clients. Using this system allows everyone to have a place to document the steps they are taking, what anomalies they’ve run into, any differences which are bound to appear, and any ideas for future investigation AFTER the initial integration is completed. In fact, if both companies have the same pro forma specifications, and better yet, access to the same specialized software – in our case, XI’s ARO Manager – then the integration is much simpler; the two most recent projects can be merged to create the new and complete master.
Click here to download the case study and discover how ARO Manager can be the tool you need to prepare for integrations.
AssetSuite’s ARO Manager is the only standardized tool for estimating and monitoring asset retirement obligations in Western Canada’s oil and gas sector. To learn how ARO Manager can help with your planning and reporting of liability management, join us for our virtual information session:
Webinar: ARO Manager for Financial Tracking & Reporting.
When: Tuesday, December 5, 2023 @ 9:30am MT
Register here, or visit XI’s website and contact XI for a demo.
Each week, XI Technologies scans its unique combination of enhanced industry data to provide trends and insights that have value for professionals doing business in the WCSB. If you’d like to receive our weekly Word to the Wise in your inbox, subscribe here.
The merger and acquisition space in oil and gas has become heated again with multiple deals announced every month. During this exciting time, finding deals that are not is critical to being competitive. That’s where XI comes in. Our role in providing data and software tools that help evaluate deals long in advance. Today, our M&A snapshot after-the-fact provides insights for your own evaluations that can be done without a data room and/or for finding “one-off deals.”
Let’s look at one of the more recent transactions announced on October 31, 2023: Pine Cliff Energy Ltd. (Pine Cliff) purchased the outstanding common shares of privately held junior, Certus Oil and Gas Inc. (Certus).
When assessing this transaction through different lenses using AssetSuite software tools, we are able to see each company’s asset profile, plus the combined entity, to gain valuable insight into the transaction beyond announced high-level acquisition highlights.
Pine Cliff contributes 79% of the production to the combined entity. The companies are relatively similar in terms of operatorship (licensee on file) in that both have a high percentage operatorship, with Pine Cliff at 89% and Certus at 92%. Both companies also have a number of partners, with Pine Cliff having approximately 66% working interest of their BOE’s and Certus at 63%.
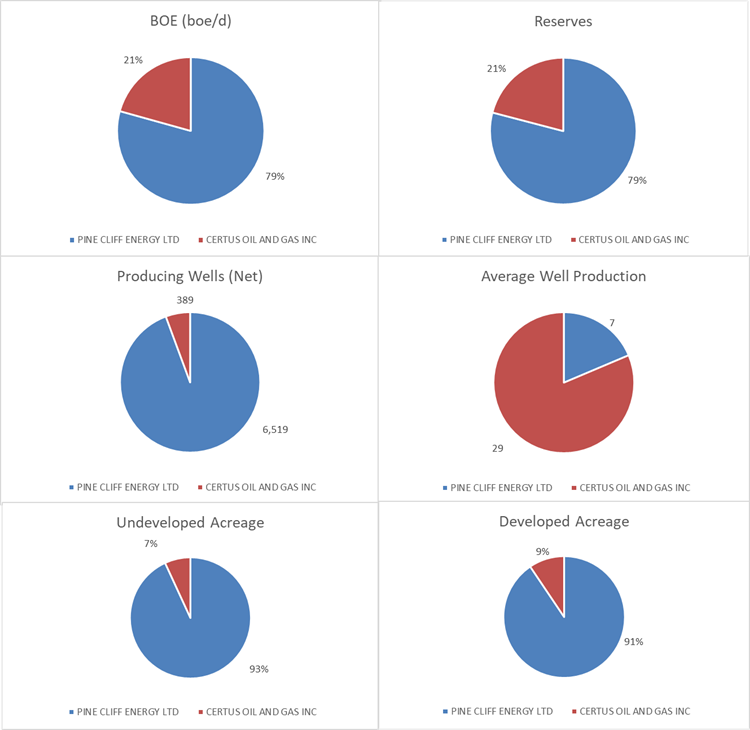
Figure 1 – Working Interest values for Pine Cliff (blue) and Certus (red). Source: AssetBook.
While the absolute numbers tell one story, accretion and dilution metrics tell us more. Looking at the AssetSuite summary, we can calculate some accretion and dilution metrics for this transaction relative to the increase in production.
Per Figure 2 below, this deal is largely accretive. Pine Cliff’s production base grew by 26%, operatorship by 1% with only BOE working interest decreasing by 1%.
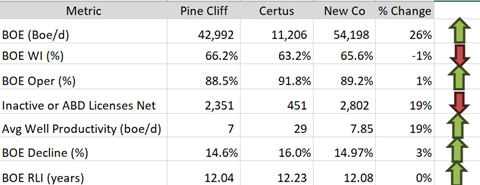
Figure 2: Deal Metrics. Above numbers are based on three-month average to August production with raw gas numbers at a 6:1 gas to oil conversion. Source: AssetBook and ARO Manager.
As we can see, the contribution of inactive licenses did have a net negative effect but by a minimal amount compared to the increase in boe/day and average well productivity.
CORE AREA
Pine Cliff mentions this transaction expands their core operations into the Caroline area of Western-Central Alberta.
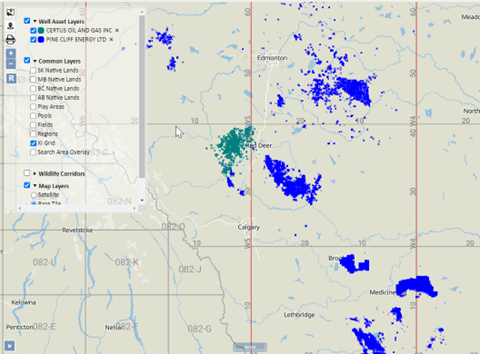
Figure 3 – Map of Pine Cliff and Certus Assets. Source: AssetBook.
Pine Cliff is very spread out over the Western Canadian Sedimentary Basin so this acquisition is an expansion into a new area instead of a consolidation of Core, as evidenced from the map above. Pine Cliff is primarily a gas company with just under 97% of their production from gas. Pre-deal, the bulk of their production came from the government-defined fields of Twining and Viking Kinsella. Post-deal, these are still core to Pine Cliff, but the production does move over more fields:.
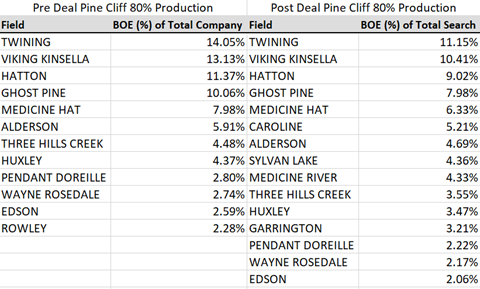
Figure 4 – Pine Cliff production by field before and after deal. Source: AssetBook.
With the AssetBook we can create an area around the Certus assets to see all other players that may be affected by this deal. Whitecap Resources Inc. (Whitecap) is the largest player in this area with approximately 35,000 boe/d of production. This area makes up 15% of Whitecap’s production. Notably, this area makes up 85% of Vesta Energy Ltd’s (Vesta) production falling in the top 10 producers of this area with approximately 13,000 boe/d. There are 92 companies with ten or more boe/day in this area.
Download more information on these 92 companies in this area here.
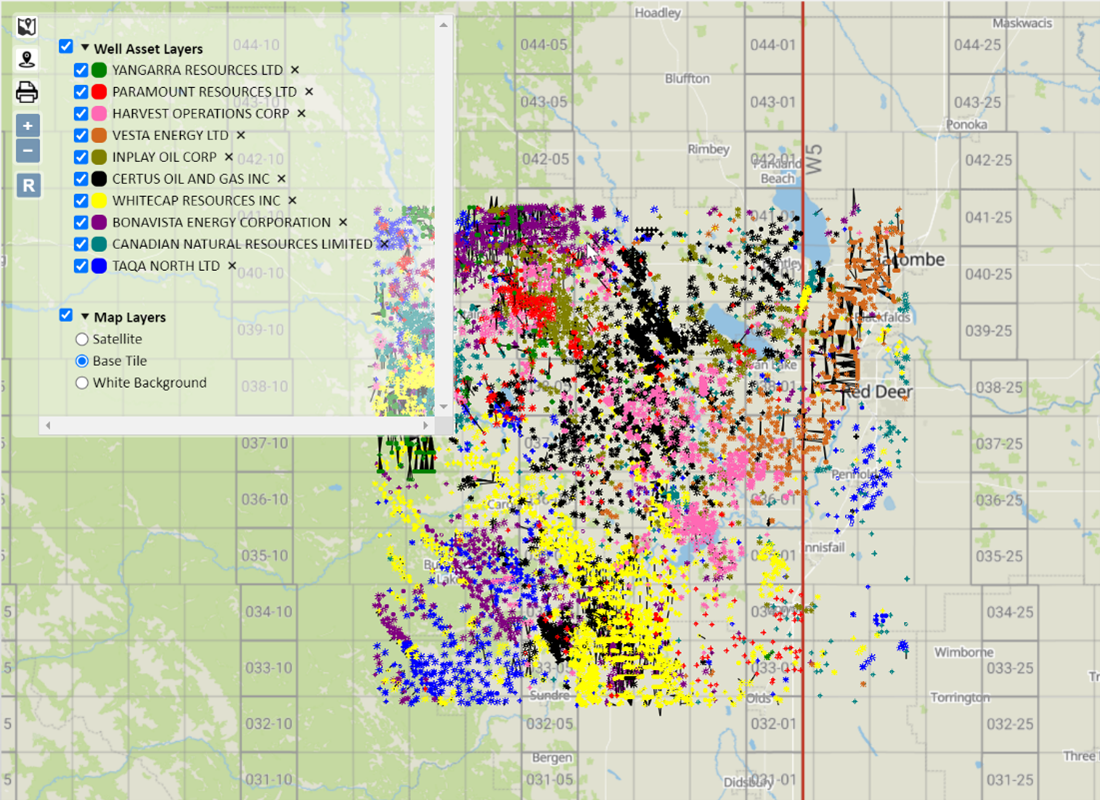
Figure 5 – Top 10 companies in Core Area. Source: AssetBook.
Liability Overview
Using an LLR analysis, this deal is slightly accretive to Pine Cliff’s LLR ratio. According to AssetBook’s LLR Module (which only accounts for licensed assets), Pine Cliff will absorb $131,868,545 in deemed liabilities, all from Alberta.
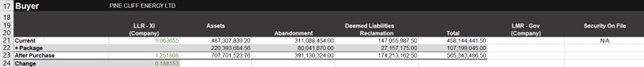
Figure 6 – LLR for Pine Cliff, pre- and post-transaction. Source: AssetBook LLR Module.
While analyzing deals after they are announced is interesting, tools that provide the leg up for looking at your own deals or finding deals proactively to create better value provide a significant advantage. For more results on this acquisition, or to learn more about how XI’s AssetSuite software can analyze potential mergers, acquisitions, and opportunities, including examining potential liabilities and emissions, click here.
Discover how XI’s AssetSuite and ARO Manager can help with the planning and reporting of liability management: contact XI for a demo.
AssetBook ARO Manager achieves a new level of SOC Compliance for improved ARO financial reporting.
Calgary, AB, March 07, 2023 – Calgary-based oil & gas data and software provider XI Technologies Inc. (“XI”) announced today the achievement of SOC 1 Type 2 compliance for their AssetBook ARO Manager software module. ARO Manager is a tool that helps companies monitor and report their Asset Retirement Obligations (ARO) to manage end-of-life commitments for oil and gas assets. The module was granted SOC 1 Type 2 compliance to the effective date of Nov 30, 2022 with a bridge letter available to end of December if required.
SOC (System and Organization Controls) is a certification standard that companies use to validate the trustworthiness of financial controls of software. Furthermore, Type 2 compliance includes the design and testing of these controls to ensure that they are operating effectively over a defined period (typically 12 months).
ARO Manager has demonstrated compliance with the standard by providing evidence that XI Technologies, the business processes, and information technology infrastructure of the application are fortified with appropriate controls, thereby safeguarding clients’ financial data.
“Ensuring our clients have secure, auditable processes has always been a foundational piece of ARO Manager,” says Amber Anderson, VP of Operations for XI Technologies. “When our clients store their financial data in our system, and count on us to correctly calculate their ARO, they’re putting an enormous amount of trust in us, which is a responsibility we take seriously. We are excited to comply and receive this SOC 1 Type 2 certification as we know it provides the assurance our clients deserve.”
Not only does ARO Manager align with SOC compliance standards, but it also offers additional audit-friendly functionalities. These features include the automatic generation of comprehensive change logs, enabling easy tracking of all modifications made to projects. Moreover, the platform facilitates effortless comparison of projects, highlighting all the differences between them, thereby ensuring complete transparency and accuracy. Such capabilities are a testament to the platform’s commitment to delivering the utmost accountability and trustworthiness to its users, satisfying the needs of both auditors and executives alike with delivery of accurate reports on current and future ARO plus standardized accretion reports for financial requirements.
To view ARO Manager’s SOC report, or for more information on AssetBook ARO Manager, get an in depth look here.
About XI Technologies
XI Technologies provides the data-driven solutions that Canadian energy companies need for informed decision-making, competitive analysis, A&D scoping, asset planning, business development, liability management, drilling, operations, regulatory compliance, and risk management.
For Immediate Release
XI Technologies welcomes Tamara Ritzel as they elevate their account management service.
Calgary, AB, February 6, 2023 – Calgary-based oil and gas data and software provider XI Technologies Inc. (“XI”) announced today the appointment of Tamara Ritzel as Senior Account Manager to oversee client needs and services.
With over twenty years of account management experience and a full network of industry connections, Tamara comes to XI excited about taking the role to the next level. “I’m passionate about building long term business relationships based on trust and respect,” she says, adding, “The oil and gas industry in Western Canada has been my home since 2005 where I have worked with software and data companies that ranged in size from small start-ups to large global enterprise solutions. Now, at XI Technologies, I can help my clients ‘find a better way’ by providing must-have solutions that are fast, efficient, and equally trusted.”
The role’s focus will be on the AssetSuite of tools for A&D prospecting and risking, strategic business planning, corporate benchmarking, Liability analysis (LLR/LCA), Asset Retirement Obligation (ARO) management, and emissions analysis. Drilling and regulatory tools will be added to the portfolio in the near future.
“Ensuring our clients have the very best software and tools for understanding asset data is our passion, our niche, and our industry reputation,” says Jennifer Baerg, VP Business Development for XI Technologies. “We are already known for our client focused approach to product development, training and support, but adding an exceptional senior account manager like Tamara to our team is part of the plan to elevate our overall client experience even further.”
For more information on AssetBook, ARO Manager, LLR or any other module within the AssetSuite, click here to view our offerings.
About XI Technologies
XI Technologies provides the data driven solutions that Canadian energy companies need for informed decision making, competitive analysis, A&D scoping, asset planning, business development, liability management, drilling, operations, regulatory compliance, and risk management.
Each week, XI Technologies scans its unique combination of enhanced industry data to provide trends and insights that have value for professionals doing business in the WCSB. If you’d like to receive our Word to the Wise in your inbox, subscribe here.
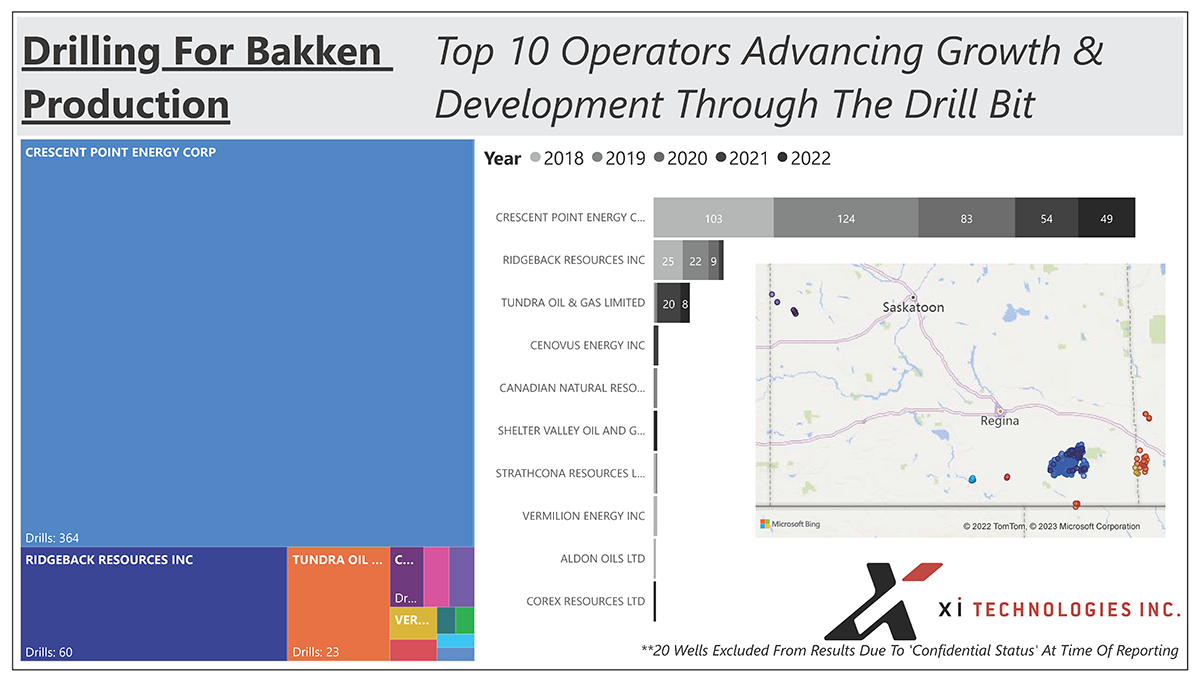
Last week, XI Technologies published an overview of the Canadian portion of the Bakken formation, looking at the production, liabilities, and emissions in the area. This week, we’ll look at drilling activity in the area. This follows similar overviews we published for the Montney, Pembina, Blueberry River, Provost, and Southwest Peace River areas.
Most active operators
In the Bakken, Crescent Point Energy Corp is the major player and have been for much of its recent history. Ridgeback Resources Inc and Tundra Oil & Gas Limited represent the other two significant players in the area.
Looking further back in the history of this play, we see much of the same, but with a few other noteworthy findings.
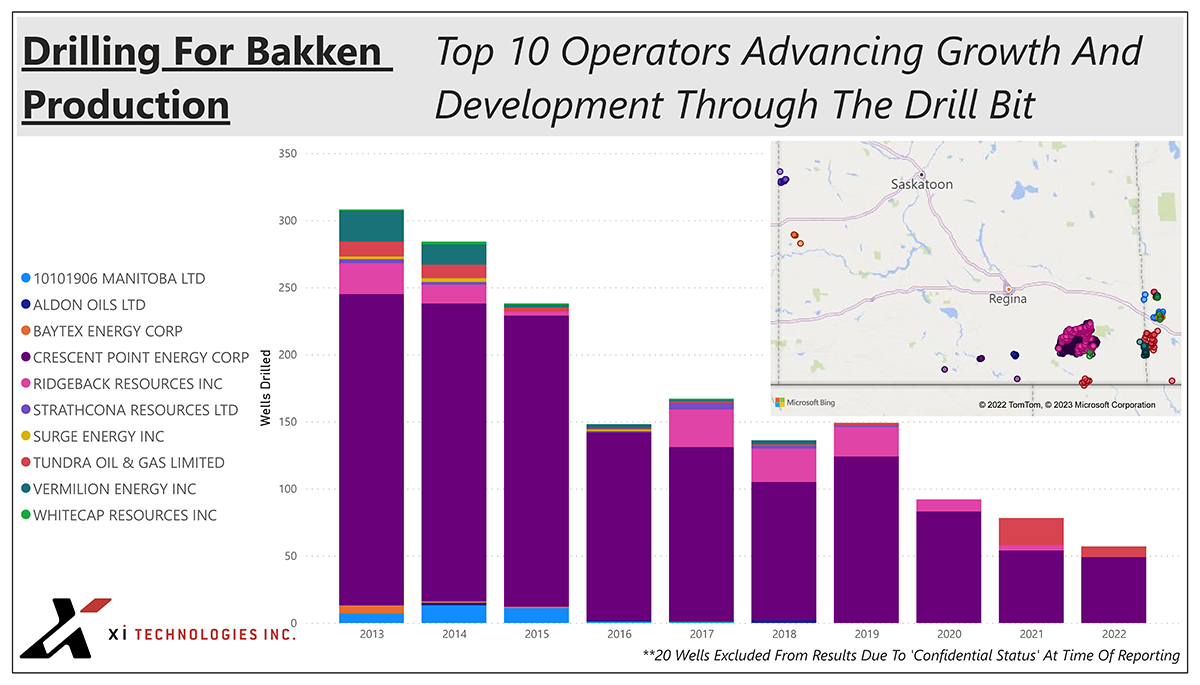
2013-2015 were peak years in the area, with a steady decline since. Crescent Point’s presence has remained consistent throughout.
Trends in wells drilled and well depths over time
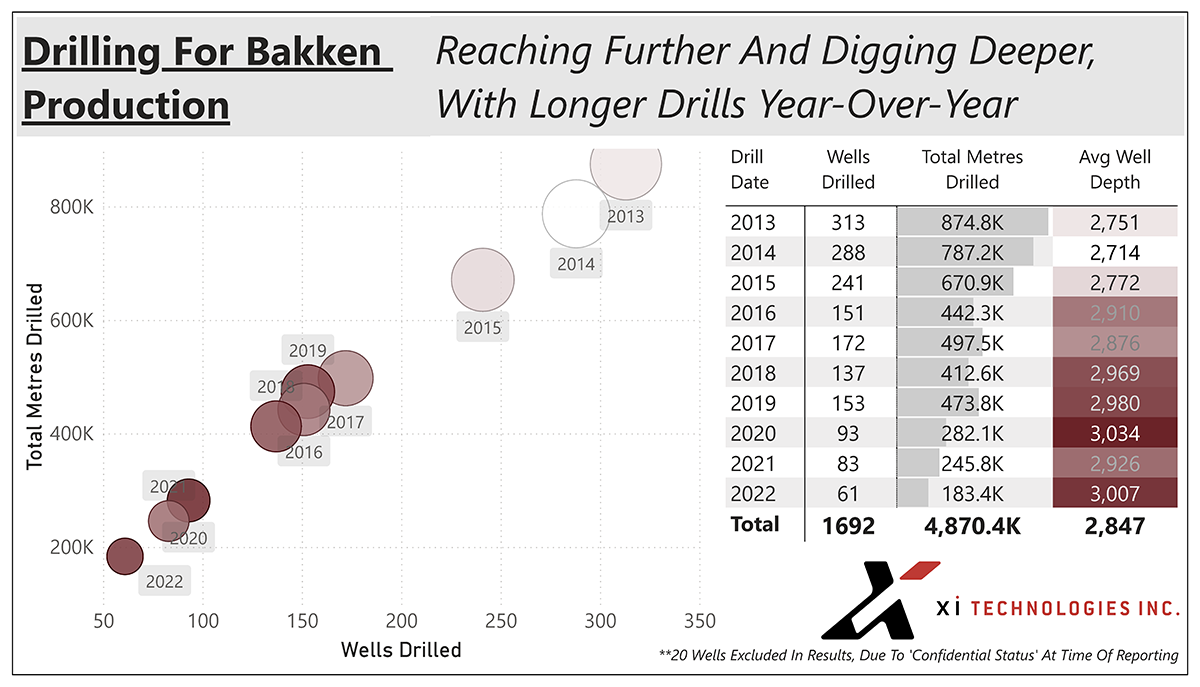
Let’s look deeper at information that tells us more about the drills themselves. As total metres drilled decline, the average well depth steadily increases.
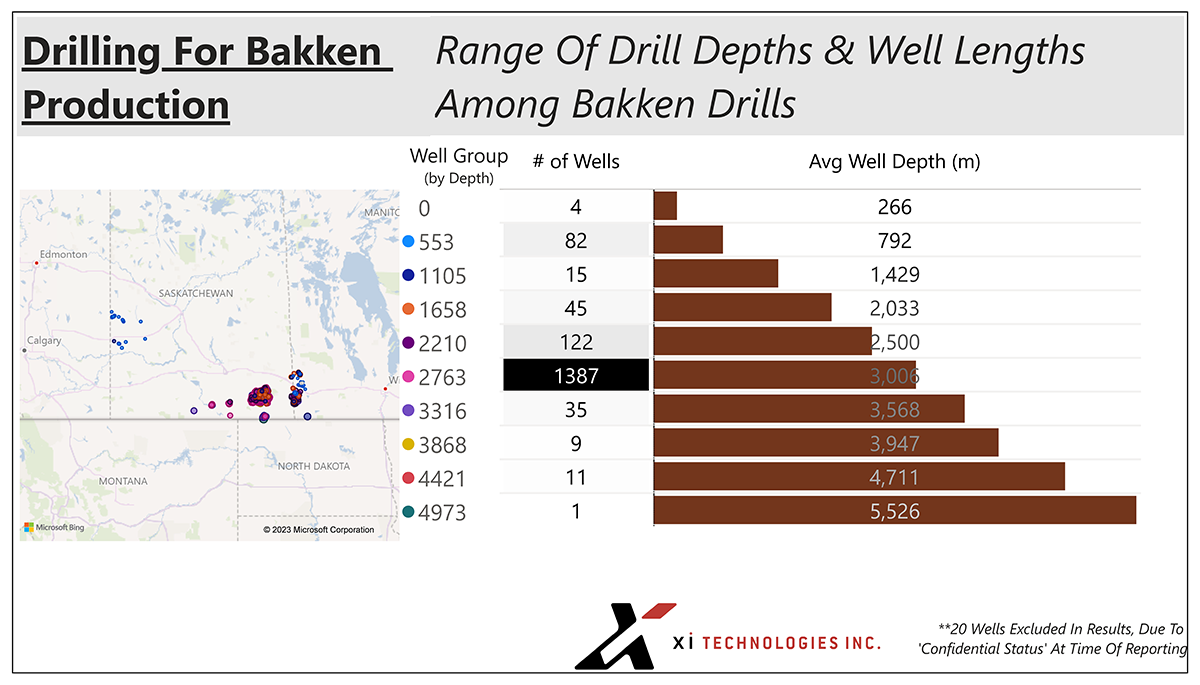
The significant majority of wells in the Bakken have an average well depth of 3006 meters.
To learn more about how XI’s OffsetAnalyst software can help you improve drilling research and performance, contact XI Technologies.